


Start with two numbers that do not belong in the same sentence, and yet describe the same organizations.
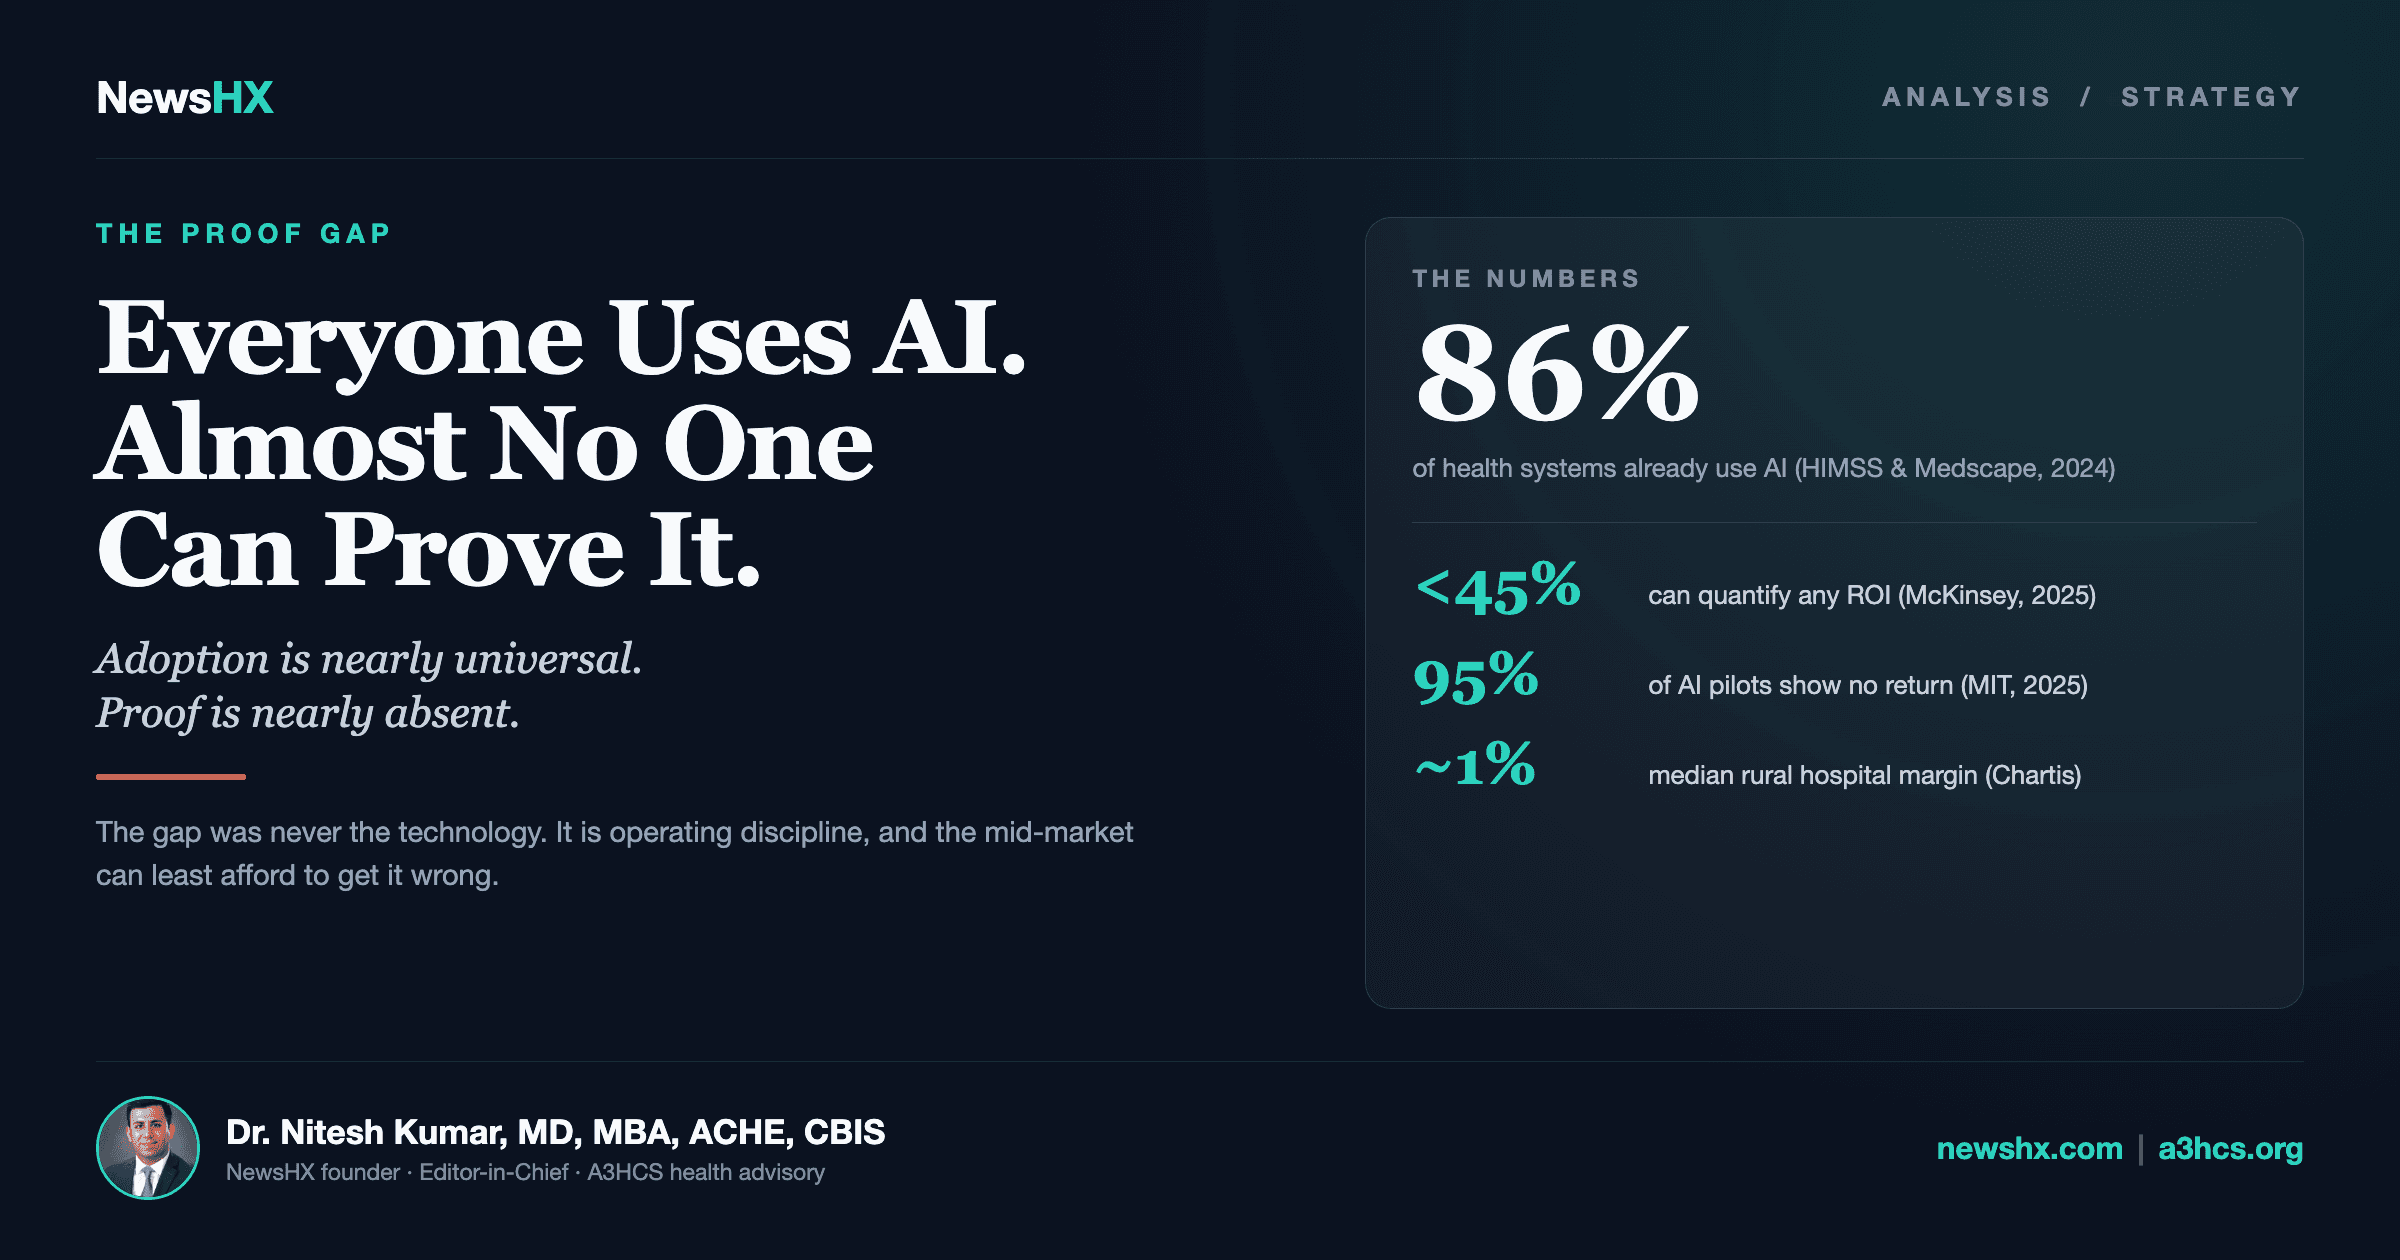
Eighty-six percent of health systems already use AI. That is the HIMSS and Medscape adoption survey, and it means the technology is effectively everywhere.1 Now the second number: in a 2025 study of enterprise generative-AI programs, ninety-five percent of pilots delivered no measurable return at all.2 That figure is cross-industry, not healthcare-specific, so read it as directional. But healthcare's own version is no better. In McKinsey's Q4 2025 survey, half of health leaders had deployed generative AI, and fewer than half of them could quantify a single dollar of return.3 The Peterson Health Technology Institute, looking hard at AI documentation assistants, found only limited evidence that they move measurable productivity or financial performance, even where they plausibly reduce burnout.4
Put those together and the picture is unambiguous. Adoption is nearly universal. Proof is nearly absent. The spending is real, the pilots are real, and the measurement is missing.
I want to make the case that this is not a technology gap and it is not a big-system problem. It is a discipline problem, it is worse in the mid-market, and it is fixable with moves that do not require the budget or the org chart that most of the published advice quietly assumes.
The productivity paradox is real, and it predates AI
Before anyone blames or credits AI, look at the longer trend, because it is the reason this matters. The Bureau of Labor Statistics keeps a dedicated productivity series for private community hospitals, and it is sobering. Over the three decades from 1993 to 2022, hospital labor productivity grew by an average of one-tenth of one percent per year.5 Not per decade. Per year. Break it into eras and it is worse than flat in the stretches that matter: productivity fell 1.5% a year from 2001 to 2007, sat exactly flat from 2007 to 2019, and declined 1.6% a year from 2019 to 2022.5 In 2022 alone it dropped two percent, as hours worked rose and output fell.5
This is a federal, primary source, and it is specific to hospitals. It says the sector was losing ground on productivity for two decades before generative AI existed. So when McKinsey frames the moment as a productivity crisis that more hiring and more technology have failed to solve, the underlying trend is not their marketing.6 It is in the government's own numbers.
Here is why that history matters for the AI question. If your operation was already automating inefficiency faster than it was removing it, then bolting AI onto it does not reverse the trend. It accelerates it. You get a faster version of the same waste.
A point solution laid over a broken workflow does not fix the workflow. It makes the waste run faster and calls it progress.
Where the money actually goes
The other reason the sector cannot buy its way out of this: a staggering share of the spend is administrative, not clinical. Independent research, not a consulting deck, puts administrative costs at 15 to 30 percent of US health spending.7 Narrow it to hospitals and the picture sharpens. One cross-national study pegged US hospital administration at 25.3 percent of total hospital expenditures, the highest of the eight countries it examined.8 The classic NEJM analysis found administration consuming 31 percent of US health spending, nearly double Canada's share.9 By credible estimates, at least half of that administrative spending is waste that does nothing for a patient's health.7
That is the target-rich environment. It is also exactly where AI should be able to help, and exactly where, so far, it mostly has not, because organizations pointed it at the wrong layer of the problem.
Why the mid-market feels this harder
Most of the serious writing on how to fix this, McKinsey's included, assumes a very particular kind of company. Stand up cross-functional "pods" for each priority domain. Staff them with designers, technologists, subject-matter experts, and product owners. Report quarterly to the executive team. Cascade AI fluency from the CEO down.3
That is excellent advice for a twelve-hospital system with a chief transformation officer and a bench of internal product managers. It is close to useless as written for the organizations that make up most of American care delivery: the 150-bed community hospital, the regional post-acute operator, the ten-site specialty group, the home health agency. They do not have spare product owners to spin into pods. They have a CFO wearing four hats and a nursing leadership team already past capacity.
So the mid-market gets the worst of both worlds. It has the same bolt-on problem as the giants, the same drawer of half-adopted point solutions, but not the transformation apparatus the playbooks assume you have to fix it. And it has something the giants do not: no margin for wasted spend. The median hospital operating margin recovered to roughly five percent in 2024, but that median hides a wide gap, with a large share of hospitals still operating in the red.10 Move to rural and it is starker: the national median rural hospital operating margin sits around one percent, and nearly half of rural hospitals run a negative margin.11 A large system can absorb a seven-figure AI experiment that produces nothing. A hospital living on a one-percent margin cannot.
Which means the mid-market cannot afford to learn the 95-percent lesson the expensive way, by deploying, hoping, and discovering later that nobody measured. It has to get the discipline right the first time, at its own scale. That is a different playbook, and it starts before you buy anything.
Before you buy another tool, run the triage
Here is the move I give every operator who tells me they are "looking at an AI vendor." Stop looking at the vendor. Pick one workflow you actually own, and before a single tool enters the conversation, sort every task in it into three buckets. I call it the Kill / Automate / Keep triage, and it is the cheapest hour of work in the whole transformation.
Kill. These are tasks that exist only because of how the process grew, not because anyone needs the output. Duplicate documentation. A sign-off no one reads. A reconciliation step that only exists to fix an error created two steps upstream. Given that at least half of administrative spending is estimated to be waste, this bucket is almost always larger than anyone expects, and it is pure profit, because eliminated work costs nothing to run and nothing to license.7 You never automate a task you can delete.
Automate. These are the repetitive, rule-bound, low-clinical-risk tasks with clear inputs and outputs, the ones sitting in the middle of a process with lots of handoffs. Back-office revenue cycle is the classic entry point for exactly this reason: payment posting, claim-status checks, appeals triage, tasks with many steps and little clinical judgment. This is the only bucket a tool belongs anywhere near, and only after the Kill pass, so you are automating the work that survived scrutiny rather than the work you were too busy to question.
Keep. This is the human bucket, and naming it protects it. Clinical judgment, the difficult payer conversation, the moment a worried family needs a person. Automating into this bucket is how you get the horror stories, and refusing to is how you keep trust. The goal was never to remove the human. It was to give the human back the hours the first two buckets were stealing.
Automate only the middle bucket. Kill the first one outright. And post a guard on the third.
Run that triage on one real workflow and you have already done more than most of the organizations in every survey above. You have separated waste from work, you know exactly where a tool could pay off and where it would be malpractice, and you have not spent a dollar yet.
Pick one domain and put a number on it
The second discipline is the one all of this data exposes: measurement. Adoption is near-universal and proof is near-absent because organizations deployed first and defined success never. The fix is not a better dashboard. It is choosing one domain, defining what value actually looks like in it, and committing to a number before you start.
And "prove" means two numbers, not one. A long-term number tied to the value you actually care about: cost to collect, days in accounts receivable, denial rate, readmissions. And a short-term number that tells you within weeks whether you are on track: minutes saved per appeal, share of claims auto-posted, exceptions routed correctly. If you cannot name both numbers before you deploy, you are not running a transformation. You are running the experiment that ends up in next year's version of that 95-percent statistic.
None of that requires a pod of product managers. It requires one owner, one domain, and the refusal to start until the scoreboard exists.
What "operating model" means when it is your patient
The language in these reports stays abstract until it becomes a person, and the domain where the abstraction gets most dangerous is the one I have spent my career inside: the care transition.
The clinical evidence here is not soft. A systematic review of 34 studies found that a median of 27 percent of hospital readmissions were judged avoidable.12 A large share of the preventable ones trace to exactly the failure you would predict: in one analysis, sixteen percent of 30-day readmissions were medication-related, forty percent of those were preventable, and roughly a third of the preventable ones were caused by transition and handoff errors, medication changes that never got communicated to the patient or the next provider.13 And the intervention that helps is almost boringly simple. Early physician follow-up within seven days of discharge was associated with roughly half the risk of 30-day readmission in a population-based cohort.14 Those are the same seven-day and medication-reconciliation metrics that strategy teams now list as AI "value drivers." To me they are the seams where patients fall through.
I work at the intersection of brain injury and recovery, where the seam is widest. Picture a patient discharged after a traumatic brain injury, moving from inpatient rehabilitation to a home health agency. The readmission math is unforgiving: TBI patients face a 30-day readmission rate around seven percent that climbs toward eighteen percent by six months, and a large fraction of those early readmissions are for complications.15 What is supposed to travel with that patient is a complete record: the seizure-prophylaxis plan, the spasticity regimen, the medication list, the therapy notes that tell the receiving team where the gains were and what to protect. What actually travels, far too often, is a faxed summary, a partial reconciliation, and a phone call that never connected. The receiving clinician rebuilds the picture from scratch, and the days lost to that reconstruction are subtracted from a recovery window that does not reopen.
That gap is the "operating model" problem made flesh. The 48-hour reconciliation metric is not a number on a slide when the miss is a post-traumatic seizure regimen that lapsed at a care transition. This is precisely the kind of high-handoff, high-consequence workflow where the triage earns its keep: kill the redundant re-charting, automate the record retrieval and the reconciliation flagging, and keep the human exactly where the judgment and the reassurance live. The technology to close that seam exists. What is usually missing is the discipline to redesign the workflow around the patient instead of bolting a tool onto the version that already fails them.
The strategy deck measures a care transition in records exchanged. The patient experiences it as whether the team receiving them knew what they were doing on day one, or spent the first week finding out.
What operators should do now
Three moves, none of which require a budget you do not have.
First, run the triage before the demo. The next time a vendor is on the calendar, cancel the reflex to evaluate the tool and instead sort the target workflow into Kill, Automate, and Keep. If you have not deleted the waste, you are not ready to automate it, and the sharpest thing you can do in that meeting is know which of your tasks should never be on the table.
Second, refuse to deploy anything you have not agreed to measure. One domain, one long-term value number, one short-term progress number, all named before the pilot starts. If your team cannot articulate the scoreboard, that is the finding. Fix that before you spend.
Third, treat the discipline gap as your advantage, not your disadvantage. The data says the giants are struggling to convert AI into return just as much as you are, they are simply struggling with more zeros. The mid-market organization that gets one domain genuinely right, waste removed, tool placed precisely, value proven on a real number, will be operating at a cost structure its larger competitors are still writing pod charters to chase. Small is not the handicap here. Undisciplined is.
The tools are ready. Adoption proves it. The organizations that win the next decade will not be the ones running the most pilots. They will be the ones that could look at their own AI spend and actually tell you what it bought.
If you are staring at an AI budget you cannot yet tie to a number, that is the work I do.
I help hospitals, health systems, post-acute operators, and specialty practices turn AI ambition into operating results: which workflows to redesign before you automate them, which single domain to prove first, and how to build a scoreboard your board will believe. The large systems have consultants for this. The organizations that make up most of American care delivery deserve the same discipline at a scale that fits them. That is the gap A3HCS was built to close.
References
- HIMSS and Medscape. "AI Adoption by Health Systems Report 2024." 86 percent of surveyed health-system respondents already use AI in their organizations.
- MIT Project NANDA. "The GenAI Divide: State of AI in Business 2025" (reported by Healthcare IT News). 95 percent of enterprise generative-AI pilots deliver no measurable P&L return. Cross-industry, not healthcare-specific; cited as directional.
- McGinty D, Eastburn J, Lamb J, Gohad N, Malani R. "The Health System CEO Imperative: Turning AI's Promise Into Performance." McKinsey & Company, June 15, 2026. Q4 2025 McKinsey US Gen AI Healthcare Survey (50 percent of leaders deployed generative AI; 45 percent of them quantified ROI).
- Peterson Health Technology Institute, reported by Healthcare Dive. "Health systems are racing to adopt AI. But can they prove its value?" Limited evidence that AI documentation assistants move measurable productivity or financial performance.
- U.S. Bureau of Labor Statistics. "Private Community Hospitals Labor Productivity." Labor productivity grew an average 0.1 percent per year 1993-2022; -1.5 percent annually 2001-2007; 0.0 percent 2007-2019; -1.6 percent annually 2019-2022; -2.0 percent in 2022.
- Han L, Elliott M, Kumar P, Wong Y. "The Real Future of Work in Healthcare." McKinsey & Company, July 2, 2026. Productivity-crisis framing and the eliminate-unnecessary-work-before-automating principle.
- Health Affairs Research Brief. "The Role of Administrative Waste in Excess US Health Spending." 2022. Administrative spending is 15 to 30 percent of US medical spending; at least half is estimated to be wasteful.
- Himmelstein DU, et al. "A Comparison of Hospital Administrative Costs in Eight Nations." Health Affairs, 2014. US hospital administration was 25.3 percent of total hospital expenditures in 2011, the highest of the eight nations studied.
- Woolhandler S, Campbell T, Himmelstein DU. "Costs of Health Care Administration in the United States and Canada." New England Journal of Medicine, 2003. Administration accounted for 31.0 percent of US health expenditures versus 16.7 percent in Canada.
- Kaufman Hall. "National Hospital Flash Report." Median hospital operating margin recovered to roughly 4.9 percent for full-year 2024, with a wide performance gap and many hospitals still in the red.
- Chartis. "The Rural Health Safety Net Under Pressure." National median rural hospital operating margin approximately 1.0 percent; 46 percent of rural hospitals operate with a negative margin; 432 rural hospitals vulnerable to closure.
- van Walraven C, et al. "Proportion of Hospital Readmissions Deemed Avoidable: A Systematic Review." CMAJ, 2011. Median avoidable-readmission fraction across 34 studies was 27.1 percent (range 5.0 to 78.9 percent).
- Uitvlugt E, et al. "Medication-Related Hospital Readmissions Within 30 Days of Discharge." Frontiers in Pharmacology, 2021. 16 percent of readmissions were medication-related; 40 percent of those potentially preventable; 30 percent of the preventable ones caused by care-transition and handoff errors.
- "Early Physician Follow-Up and 30-Day Readmission." PLOS ONE, 2017. Early physician follow-up within seven days of discharge was associated with roughly half the hazard of 30-day readmission (NSTEMI HR 0.47; heart failure HR 0.54).
- "Traumatic Brain Injury Readmission Cohort." 30-day readmission rate approximately 7.0 percent, rising to 12.7 percent at three months and 17.6 percent at six months; 30.1 percent of 30-day readmissions were for a complication.