NewsHX — Healthcare Intelligence Across the Acute, Post-Acute, and Home Health Continuum
Analysis
From the Editor
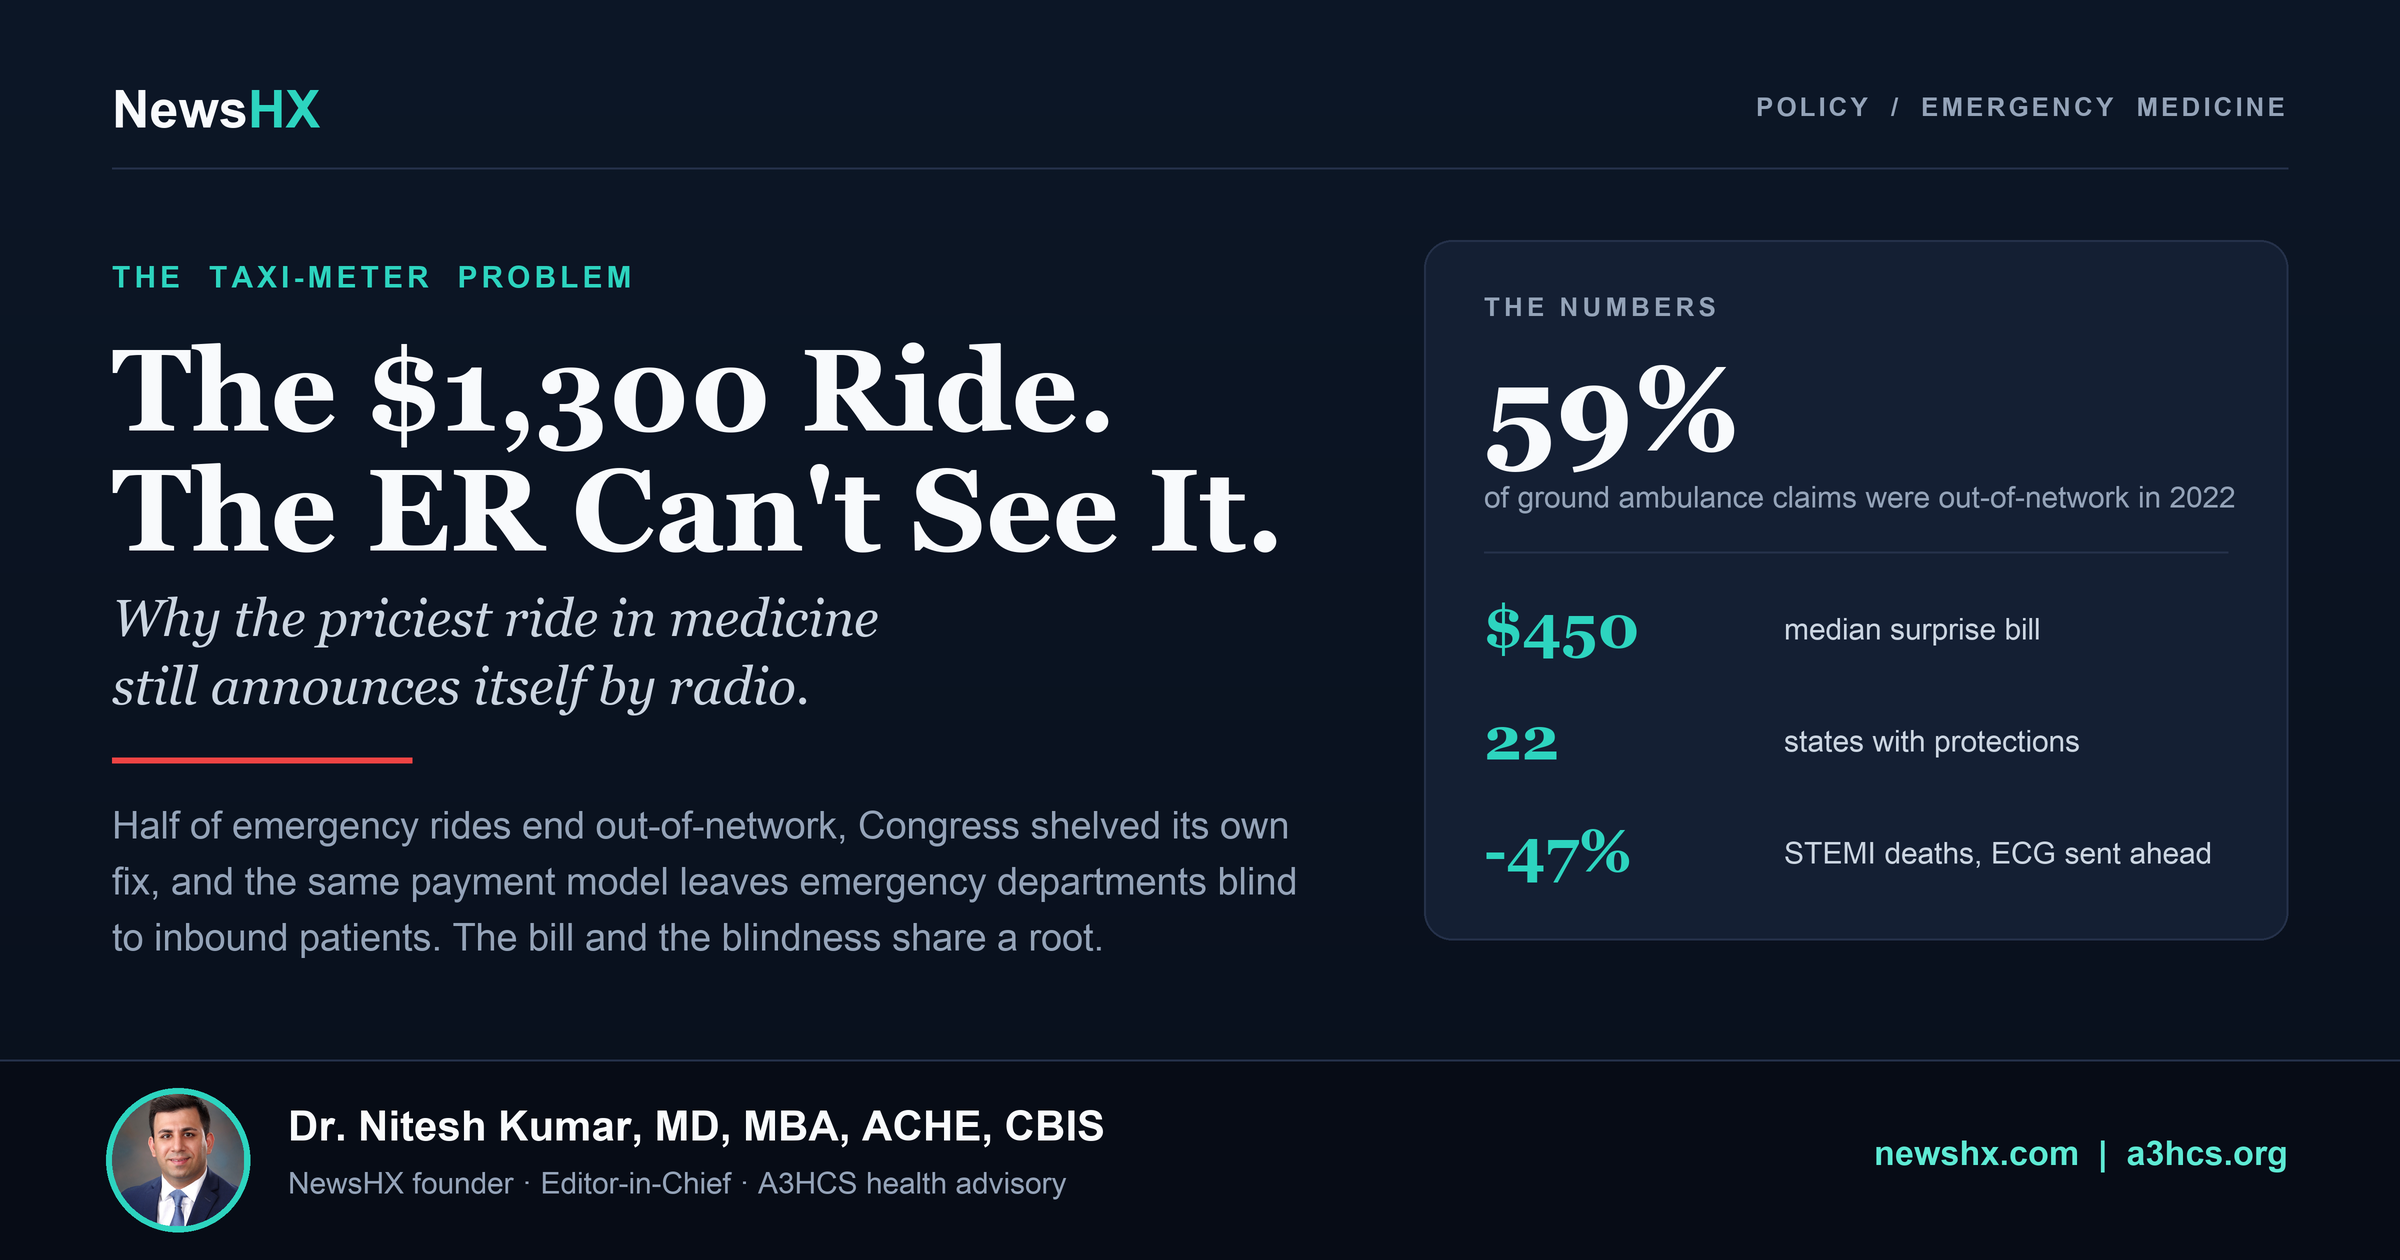
The Ambulance Costs $1,300. The ER Still Can't See It Coming.
Half of emergency ambulance rides end in an out-of-network charge, the median surprise bill runs about $450, and Congress left ground ambulances out of the No Surprises Act on purpose. The fix it commissioned instead has sat unanswered since August 2024. But the bill is only half the failure. The same taxi-meter payment model that produces $1,277 base charges also leaves emergency departments blind to inbound patients, even though sending the prehospital ECG ahead is associated with cutting STEMI mortality nearly in half. The bill and the blindness grew from the same root, and so does the fix.

210 Drugs Won FDA Approval in Six Years. Every One Had a Federal Grant Behind It.
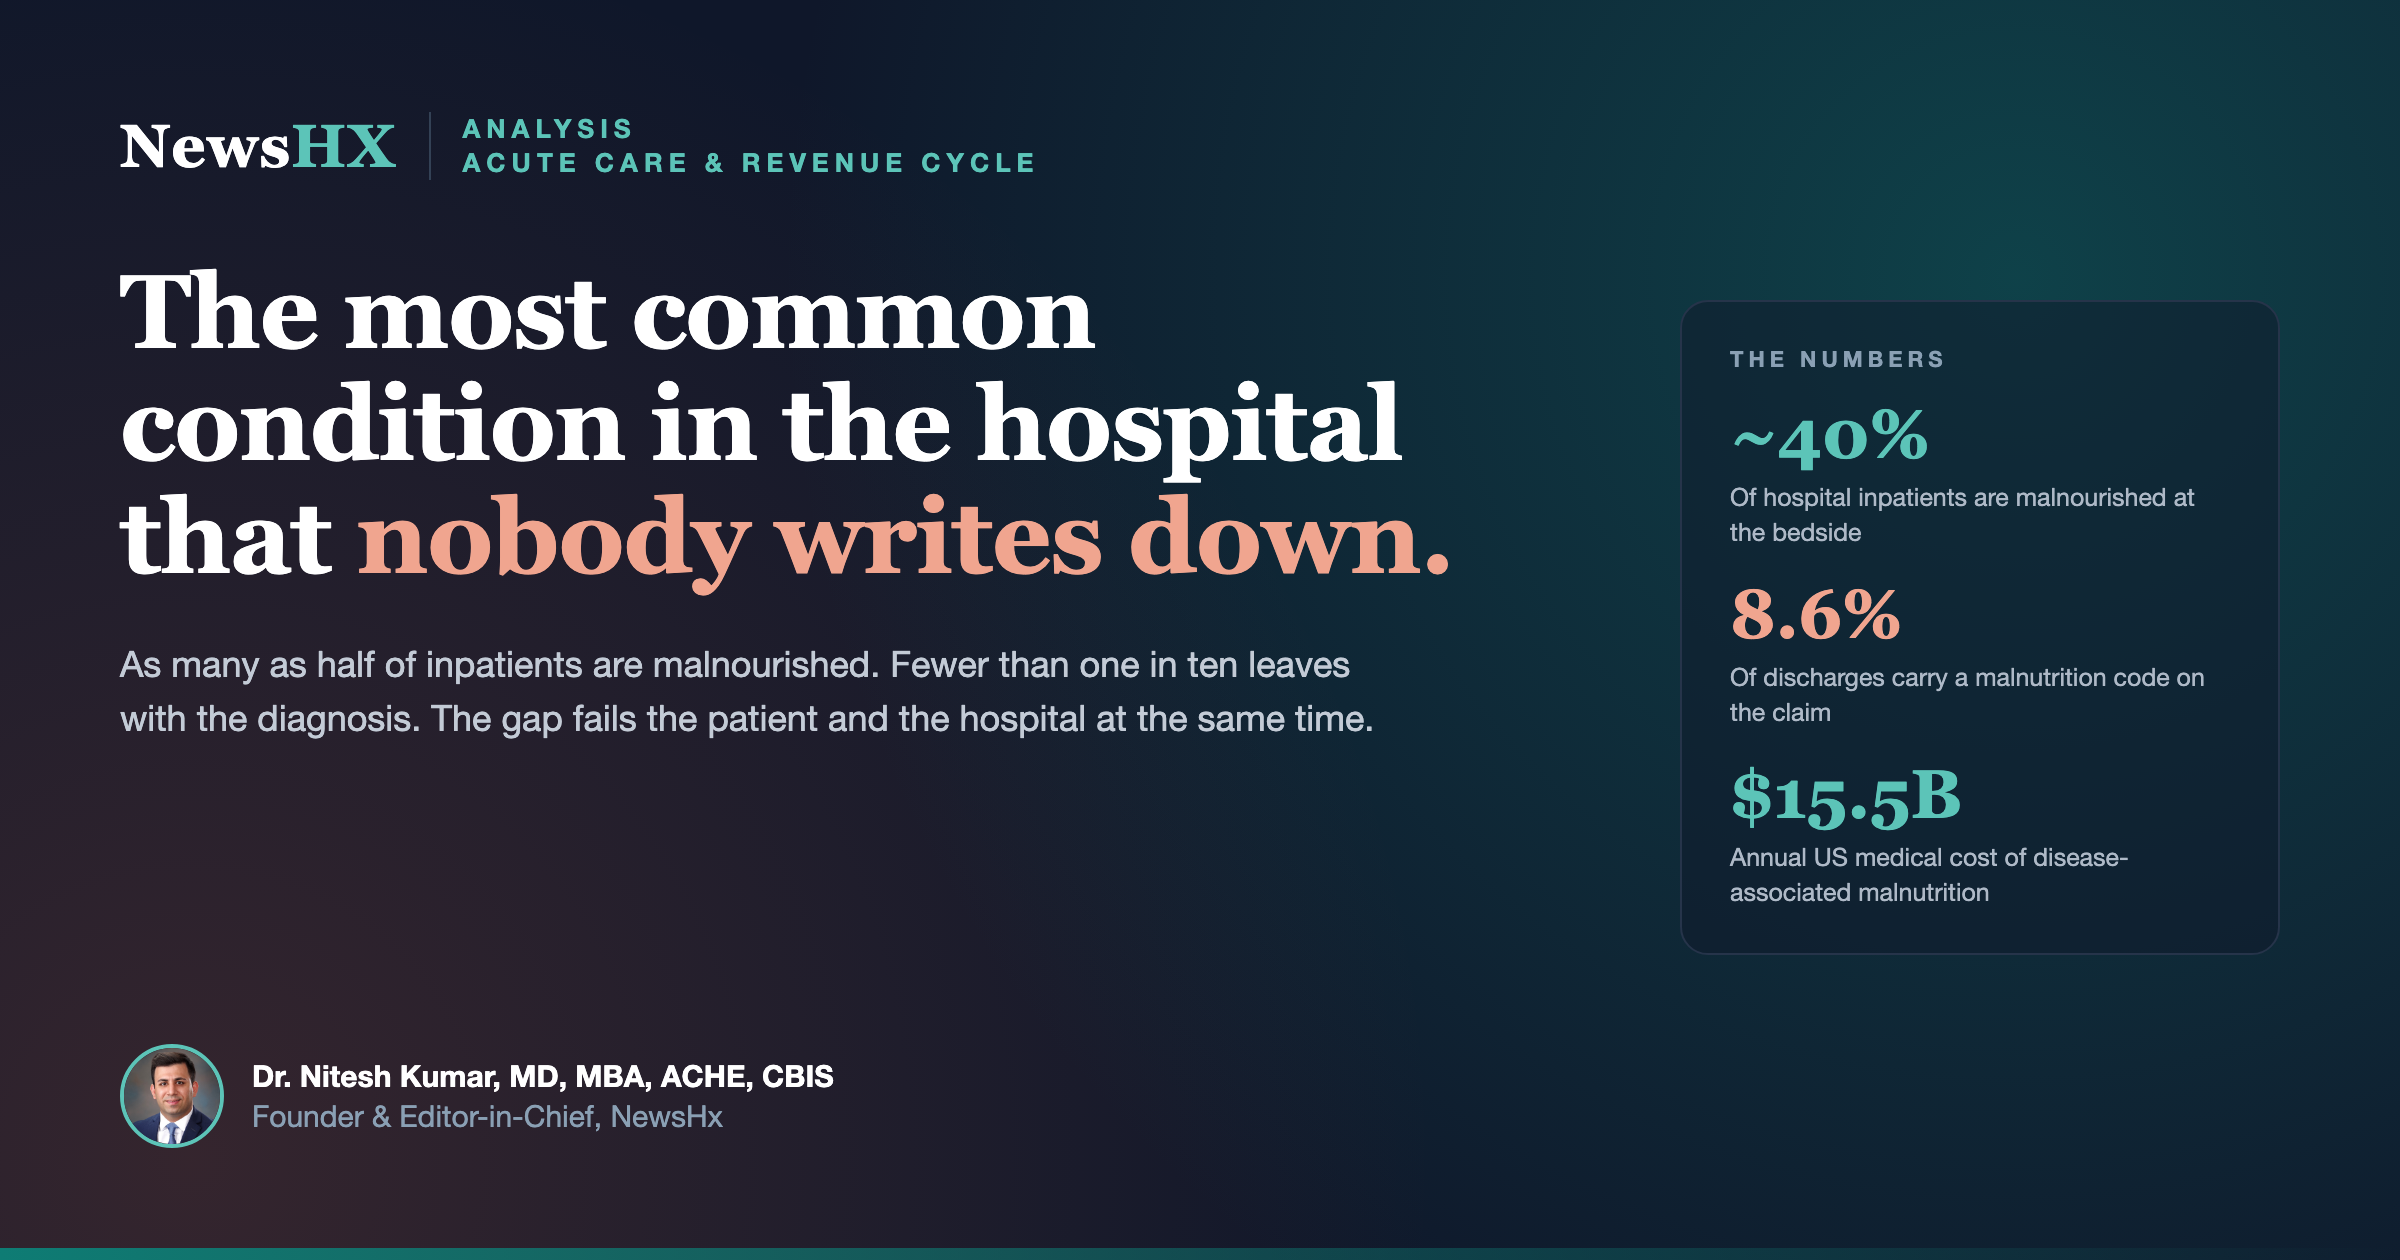
As Many as Half of Hospital Patients Are Malnourished. Fewer Than One in Ten Leaves With the Diagnosis.

Medical School Never Taught You the Law. It Governs Every Shift You Work Anyway.
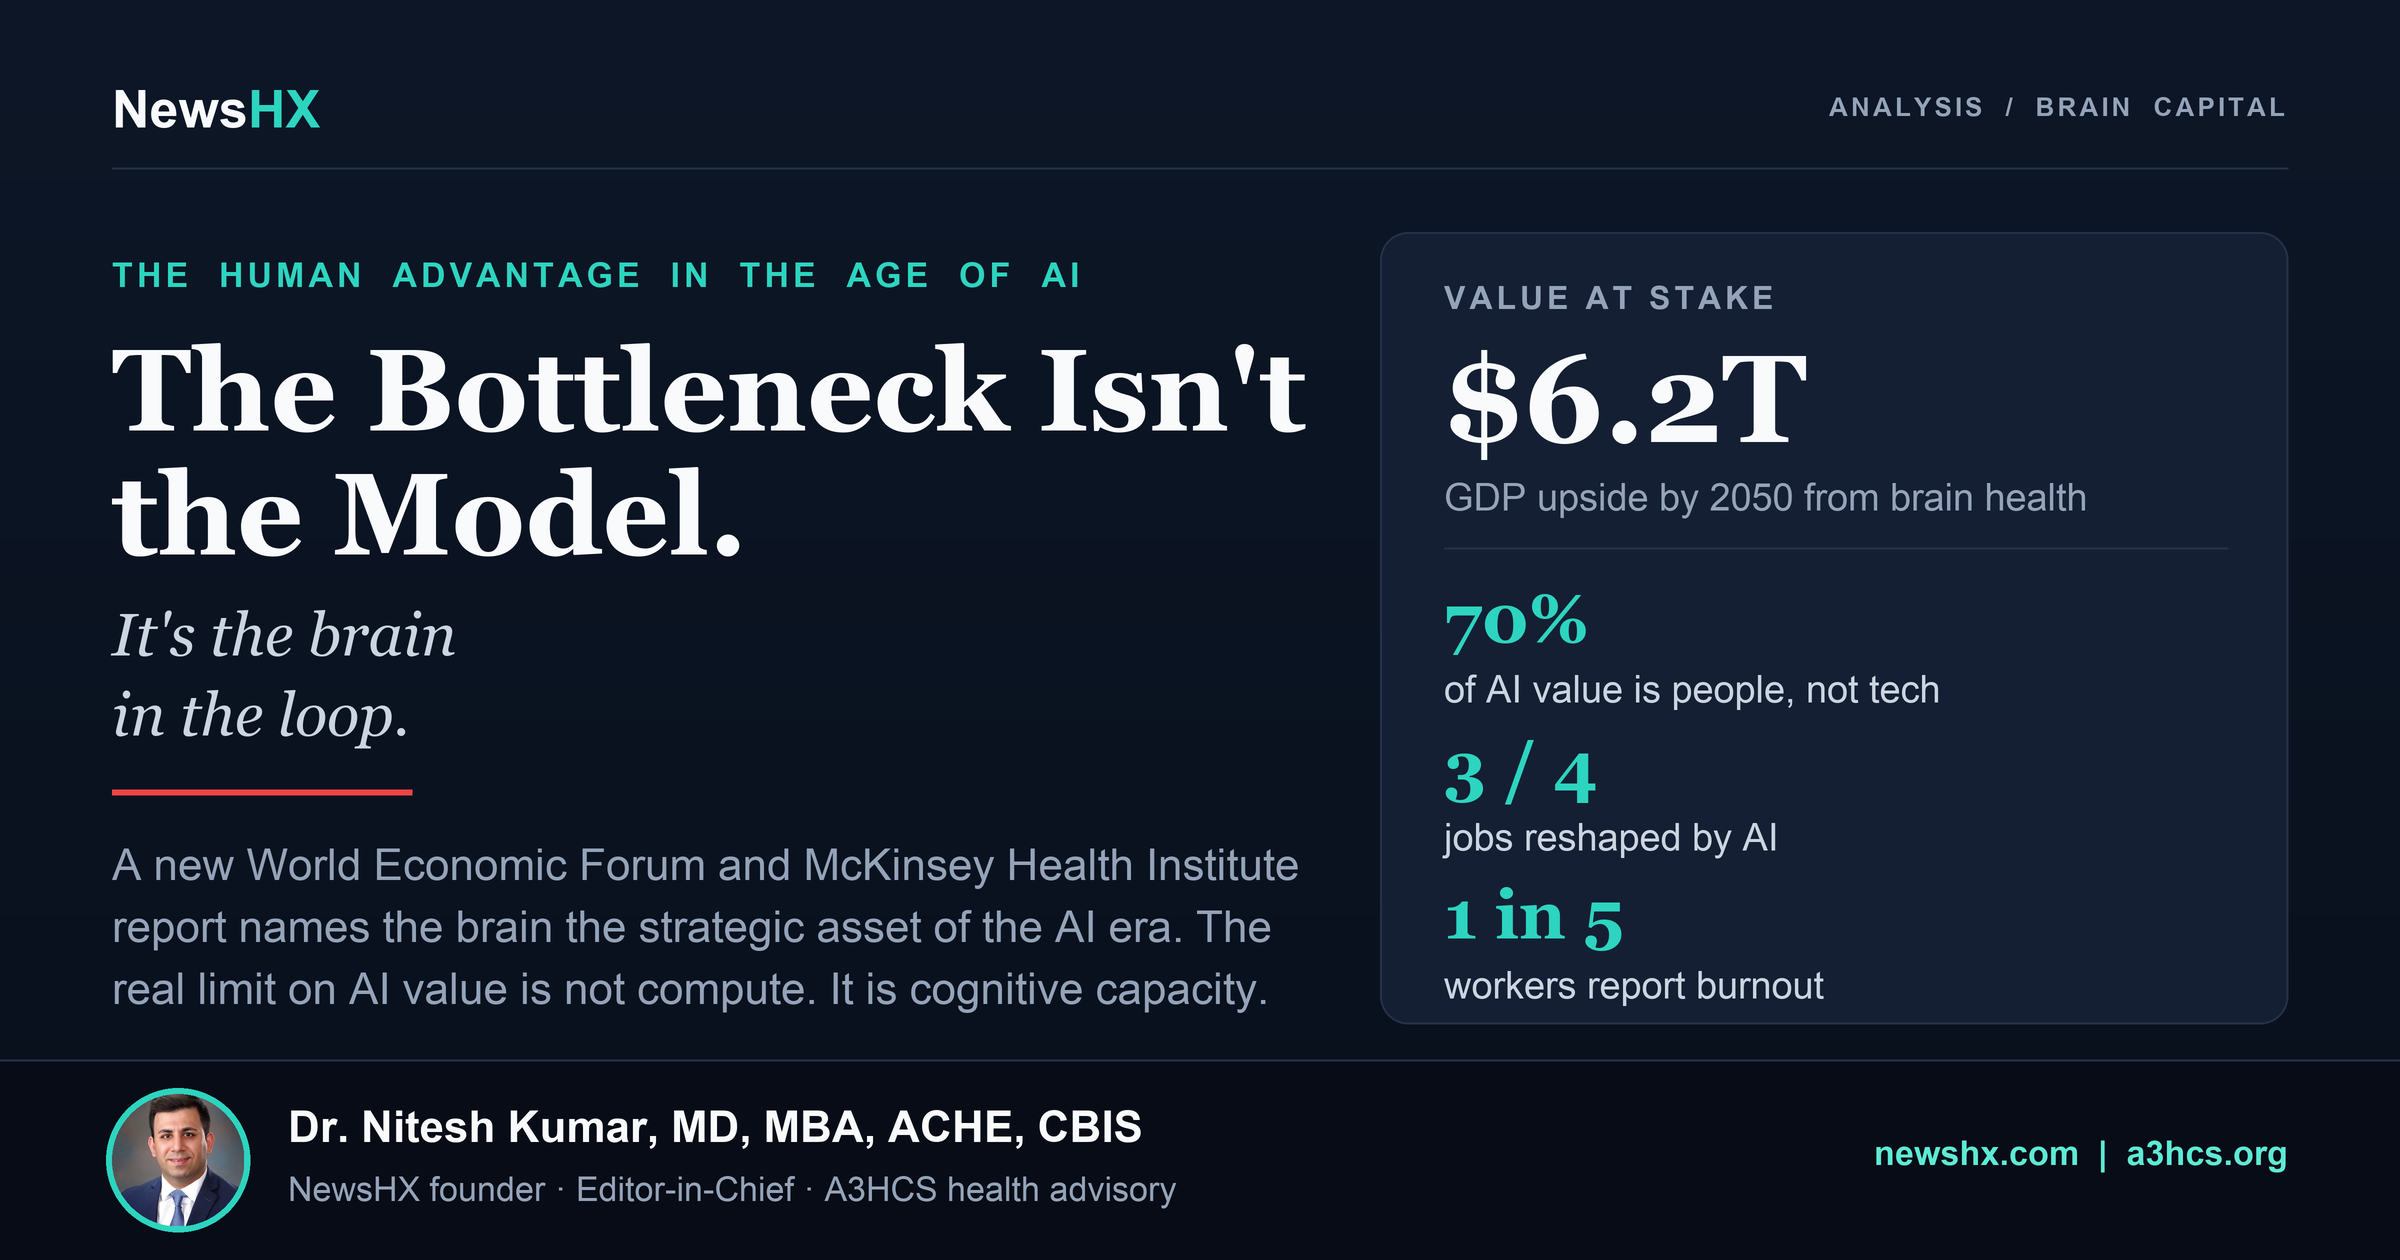
The Bottleneck Isn't the Model. It's the Brain.
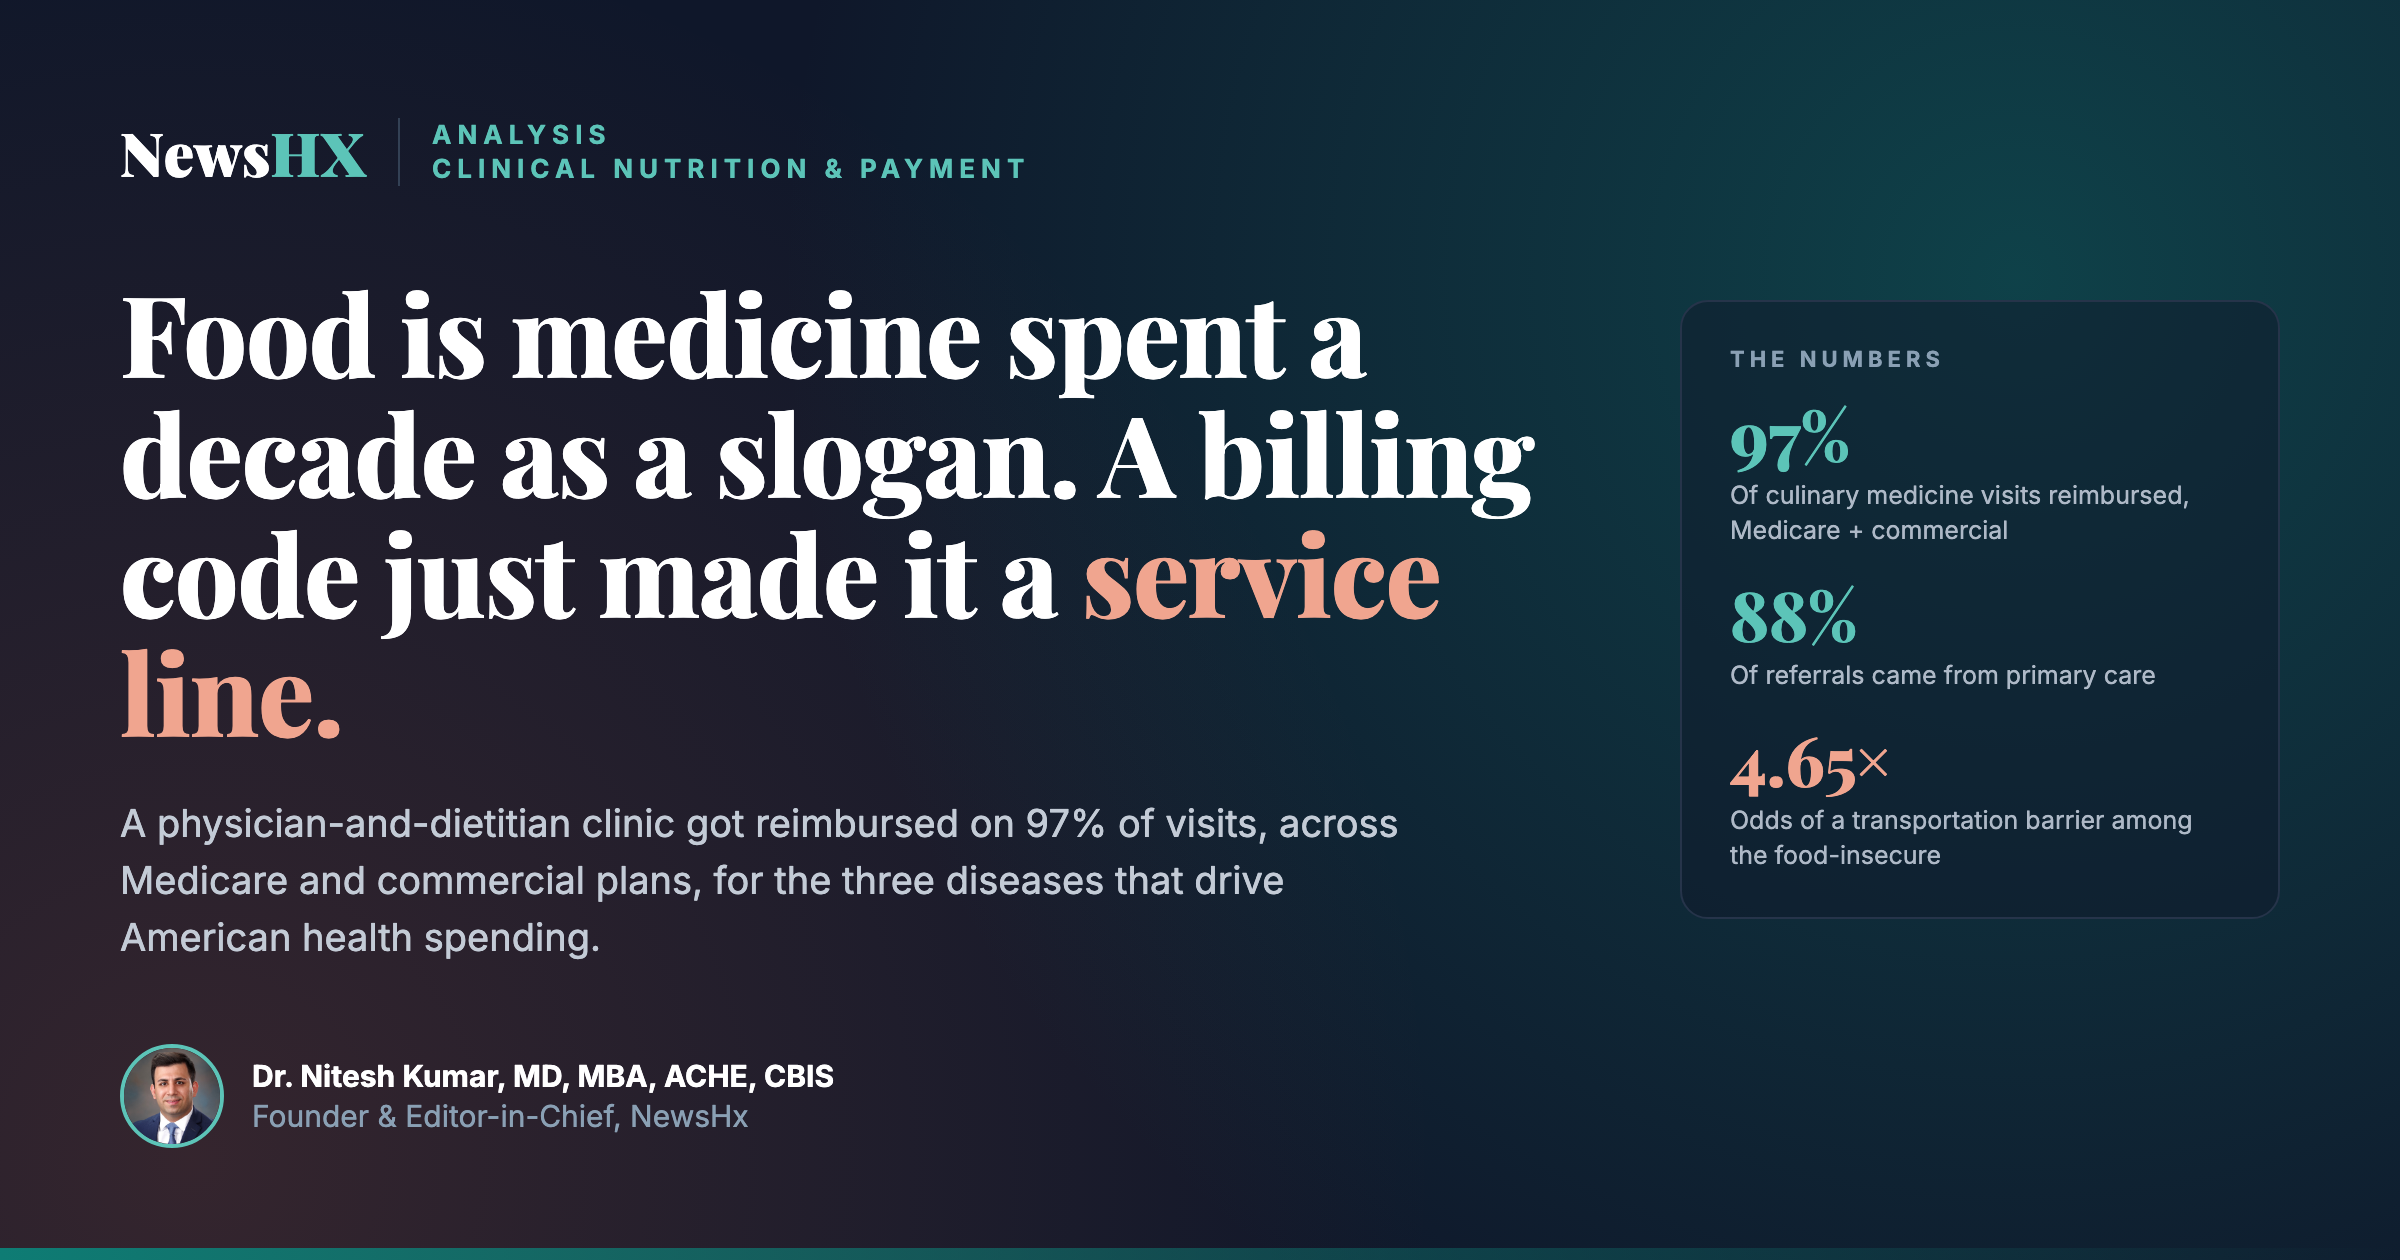
Food Is Medicine Spent a Decade as a Slogan. A Billing Code Just Made It a Service Line.
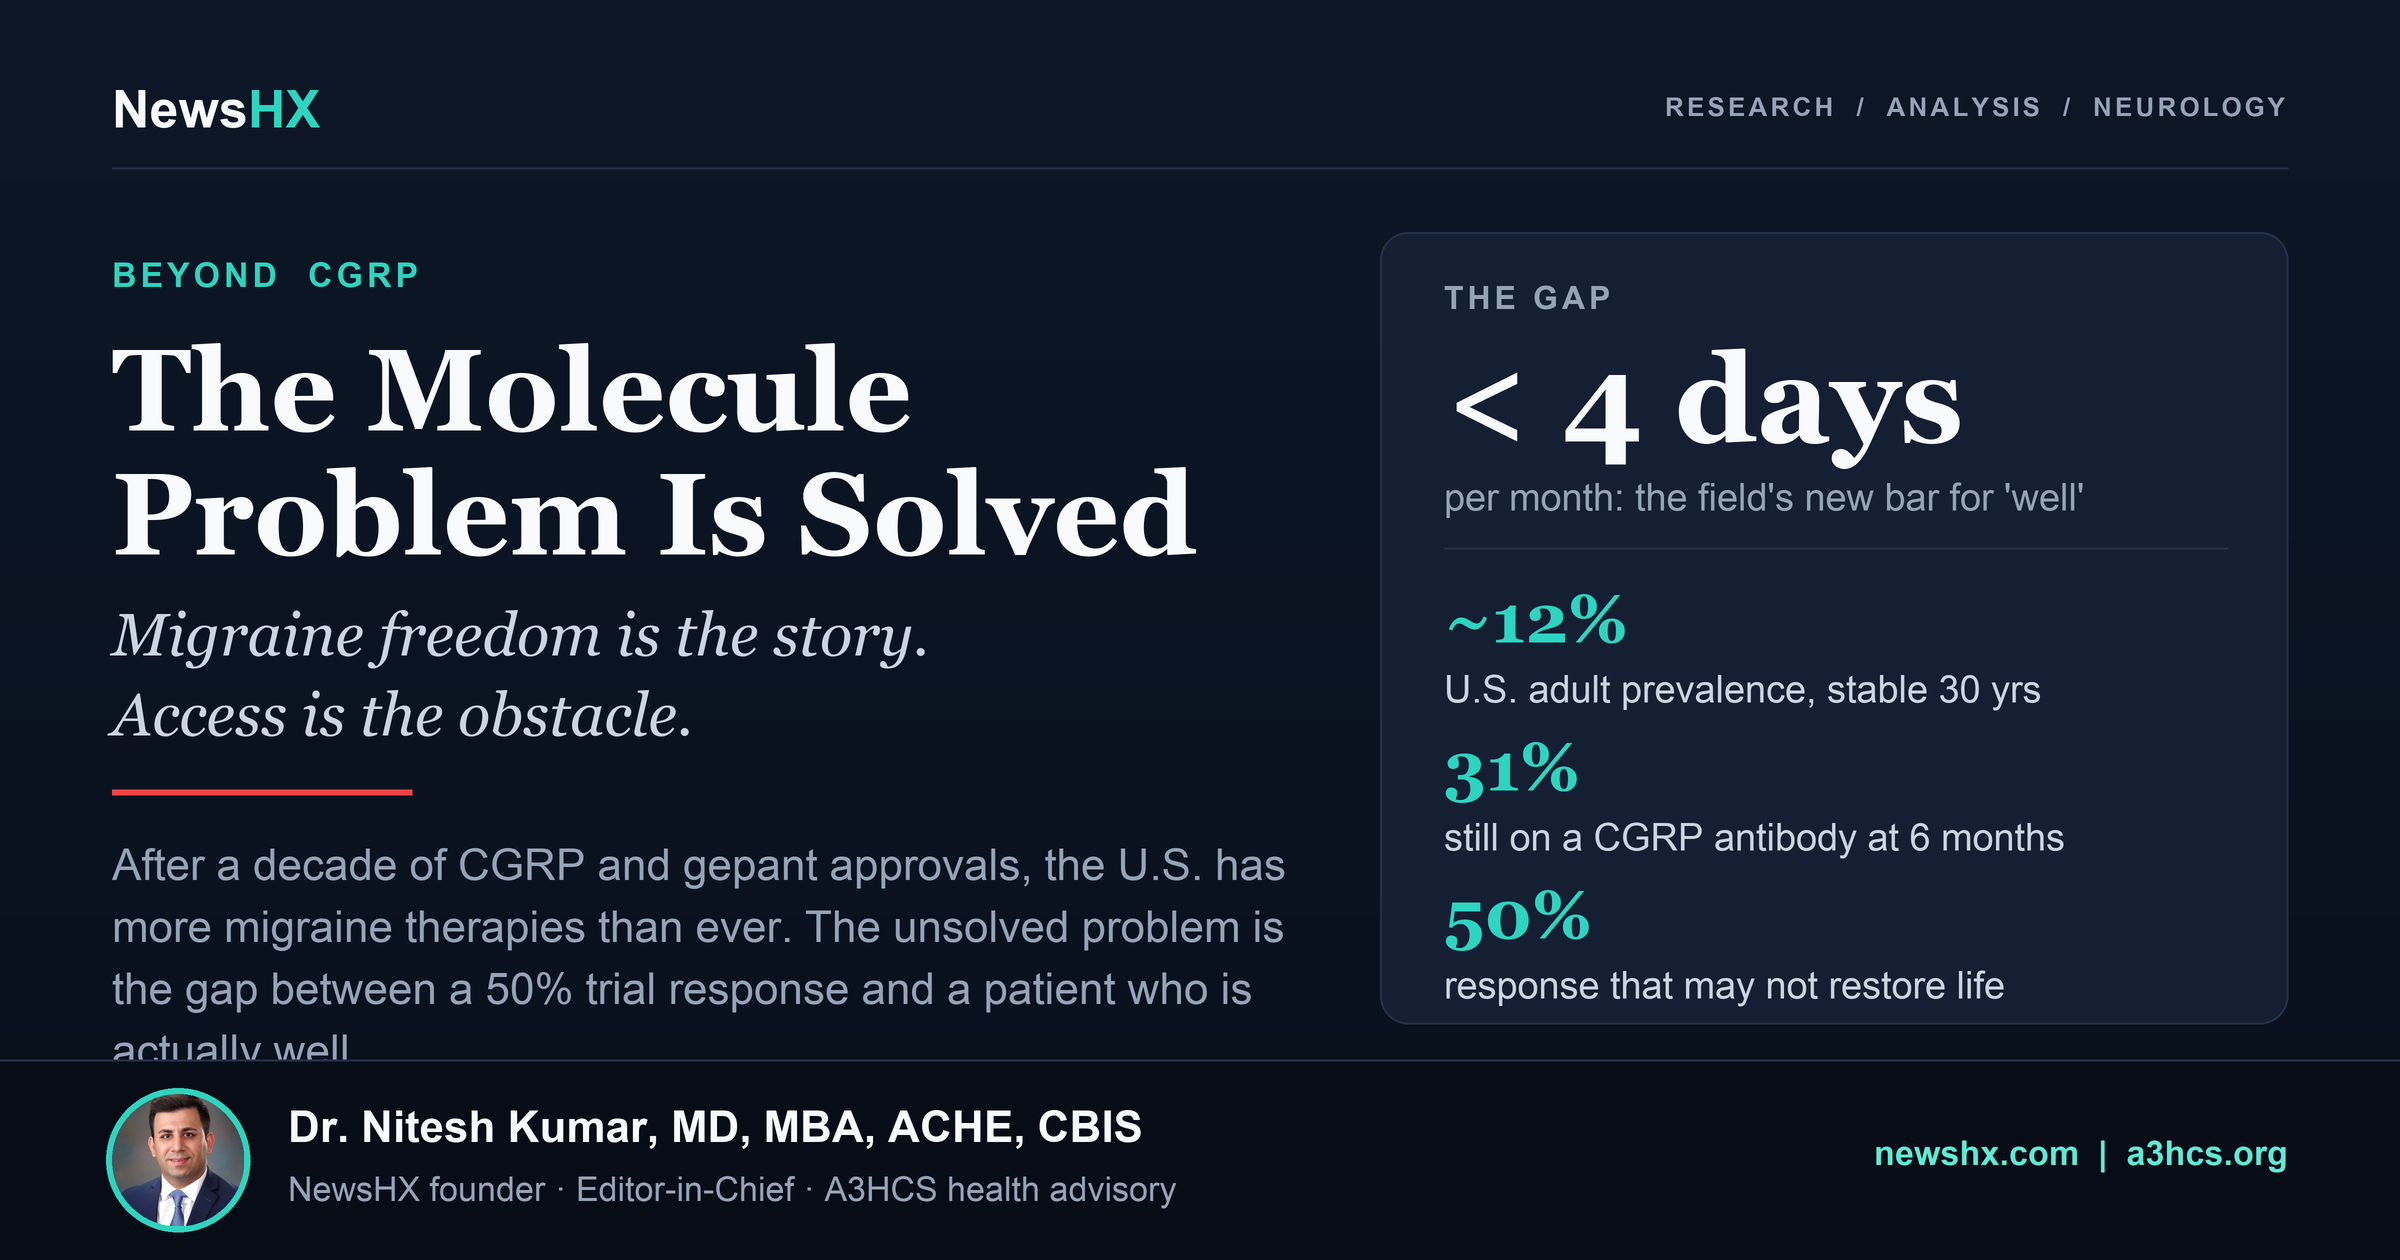
The Migraine Drug Problem Is Largely Solved. The Migraine Freedom Problem Is Not.
Health Signals
Stories corroborated across multiple independent outlets — what the whole industry is covering right now, with single-source noise filtered out.
A story appears here only when 2 or more of severalindependent sources report the same event. Corroboration reduces noise — it is not an endorsement of any single outlet's framing.
U.S. Health Statistics
Key vital statistics for the United States based on CDC and Census Bureau data.
United States Vital Statistics
US Population
0
Census Bureau estimate, July 2025
Daily Births
0
10.6 per 1,000 population
Daily Deaths
0
9 per 1,000 population
Life Expectancy
0
Years at birth (2024 final — record high)
Data at a Glance
U.S. Health By the Numbers
Mortality and health benchmark data from CDC National Vital Statistics System.
Leading Causes of Death
Annual U.S. deaths (thousands) — CDC NCHS, 2024 final
Mortality Trends (2018–2024)
Annual deaths in thousands — top 3 causes · Source: CDC NVSS
U.S. Health Indicators
Key benchmarks — Sources: CDC, Census Bureau, CMS
Life Expectancy
79%
Vaccination Rate
69%
Insured Population
92%
Preventable Deaths
34%
Emergency Health & Public Safety
Latest alerts and updates from CDC, WHO, and public health agencies
National Emergency
911
Life-threatening emergencies
Poison Control
1-800-222-1222
24/7 poison emergency help
Crisis Hotline
988
Suicide & Crisis Lifeline
CDC wastewater surveillance
Wastewater surveillance detects viral shedding across a community regardless of testing or care-seeking — an early, testing-independent read on where respiratory viruses are rising. Levels reflect concentration in sewersheds, not case counts.
Your Local Health Risk Assessment
Enter your zip code for live local conditions — air quality, UV, heat, active weather alerts, and your community's CDC health profile
Enter your zip code above to see your local environmental health snapshot
Healthy People 2030
Tracking national progress toward data-driven objectives to improve health and well-being over the decade. These Leading Health Indicators (LHIs) represent high-priority public health issues.
Attain healthy, thriving lives
Free of preventable disease, disability, injury, and premature death
Eliminate health disparities
Achieve health equity and attain health literacy
Create environments that promote health
Social, physical, and economic environments that promote health and well-being
Promote healthy development
Healthy development, healthy behaviors, and well-being across all life stages
On Track
Meeting 2030 target pace
Improving
Moving in right direction
Little Change
Needs increased effort
Getting Worse
Requires urgent action
Persons with Medical Insurance
AHS-01improvingIncrease the proportion of people with health insurance
Colorectal Cancer Screening
C-07improvingIncrease colorectal cancer screening based on most recent guidelines
Calories from Added Sugars
NWS-10improvingReduce consumption of calories from added sugars
Adult Cigarette Smoking
TU-02on trackReduce current cigarette smoking in adults
Seasonal Influenza Vaccination
IID-08little changeIncrease annual influenza vaccination coverage
Infant Deaths
MICH-04improvingReduce the rate of infant deaths
Adolescent Depression Treatment
MHMD-02improvingIncrease treatment for adolescents with major depressive episodes
Childhood Obesity
NWS-03getting worseReduce obesity in children and adolescents
Adults Meeting Physical Activity Guidelines
PA-10improvingIncrease adults meeting aerobic and muscle-strengthening guidelines
4th Grade Reading Proficiency
SDOH-01getting worseIncrease 4th grade students reading at or above proficient level
Working-Age Employment
SDOH-03on trackIncrease employment among working-age population
Unhealthy Air Exposure
EH-03improvingReduce number of people exposed to unhealthy air
Binge Drinking
AH-08getting worseReduce binge drinking in past 30 days
Hypertension Control
HDS-04little changeIncrease blood pressure control among adults with hypertension
Household Food Insecurity
NWS-04getting worseReduce household food insecurity and hunger
Source: HHS Healthy People 2030 program. Baseline and target values reflect official HP2030 objectives. Current estimates are based on CDC tracking data and may be updated as new surveillance data becomes available. For authoritative data, visit health.gov/healthypeople.
FDA Safety & Regulatory News
Live recalls, warnings, and IARC-classified cancer agents under FDA scrutiny
U.S. Mortality Data Explorer
National leading causes of death, age-adjusted rates, state-level comparison, and historical trends. Sourced from CDC NVSS, NCHS Open Data, HDPulse, and WHO.
Total Deaths Shown
2,240,974
Filtered results · CDC NVSS 2023
Causes Shown
11
of 11 total
Preventable Causes
10
can be reduced
Viewing
All Ages
All sexes
Heart Disease
ChronicPreventableCancer
ChronicPreventableUnintentional Injuries
InjuryPreventableStroke
ChronicPreventableCLRD
ChronicPreventableAlzheimer's Disease
ChronicDiabetes
ChronicPreventableKidney Disease
ChronicPreventableLiver Disease
ChronicPreventableCOVID-19
InfectiousPreventableSuicide
InjuryPreventableNational data: CDC NVSS 2023 Final (deaths & percentages) and CDC Open Data API for age-adjusted rates and state comparisons (1999–2017 NCHS dataset). Age-adjusted rates per 100,000 allow valid comparison across states and time periods regardless of population age structure.
Reference & Education
Legal Medicine & Professionalism
Clinical frameworks, ethical guidance, and legal standards for providers across the care continuum.
Legal & Ethical Foundations
- Capacity & Consent
- Medical Law
- Ethics of Disclosure
- Professionalism
Patient Safety & Quality
- Error Reporting
- QI Frameworks
- Patient Communication
- High Reliability
Palliative & End-of-Life
- Goals of Care
- Advance Directives
- Grief Counseling
- Death & Dying
Crisis & Behavioral Medicine
- Suicidality
- Agitation & Violence
- De-escalation
- Safety Planning
Vulnerable Populations
- IPV & Sexual Violence
- Elder Abuse
- Child Maltreatment
- Human Trafficking