


A patient is admitted for pneumonia. She is 78, has lost weight since her husband died, eats a third of what arrives on the tray, and her arms have gone thin in a way the admitting note does not mention. She has a diagnosis nobody is going to write down. The pneumonia gets a code. The malnutrition, which will lengthen her stay, weaken her recovery, and raise the odds she is back within a month, does not. She is discharged. On the claim, she was never malnourished at all.
This is not a rare miss. It is the base case. Malnutrition is arguably the most prevalent underdocumented condition in American hospitals, and the striking part is that nobody in the building disagrees that it matters. The dietitians know. The nurses charting intake know. The evidence base is settled. What fails is the connective tissue between knowing and recording, and in American medicine a condition that is not recorded is a condition that is neither treated nor paid for.
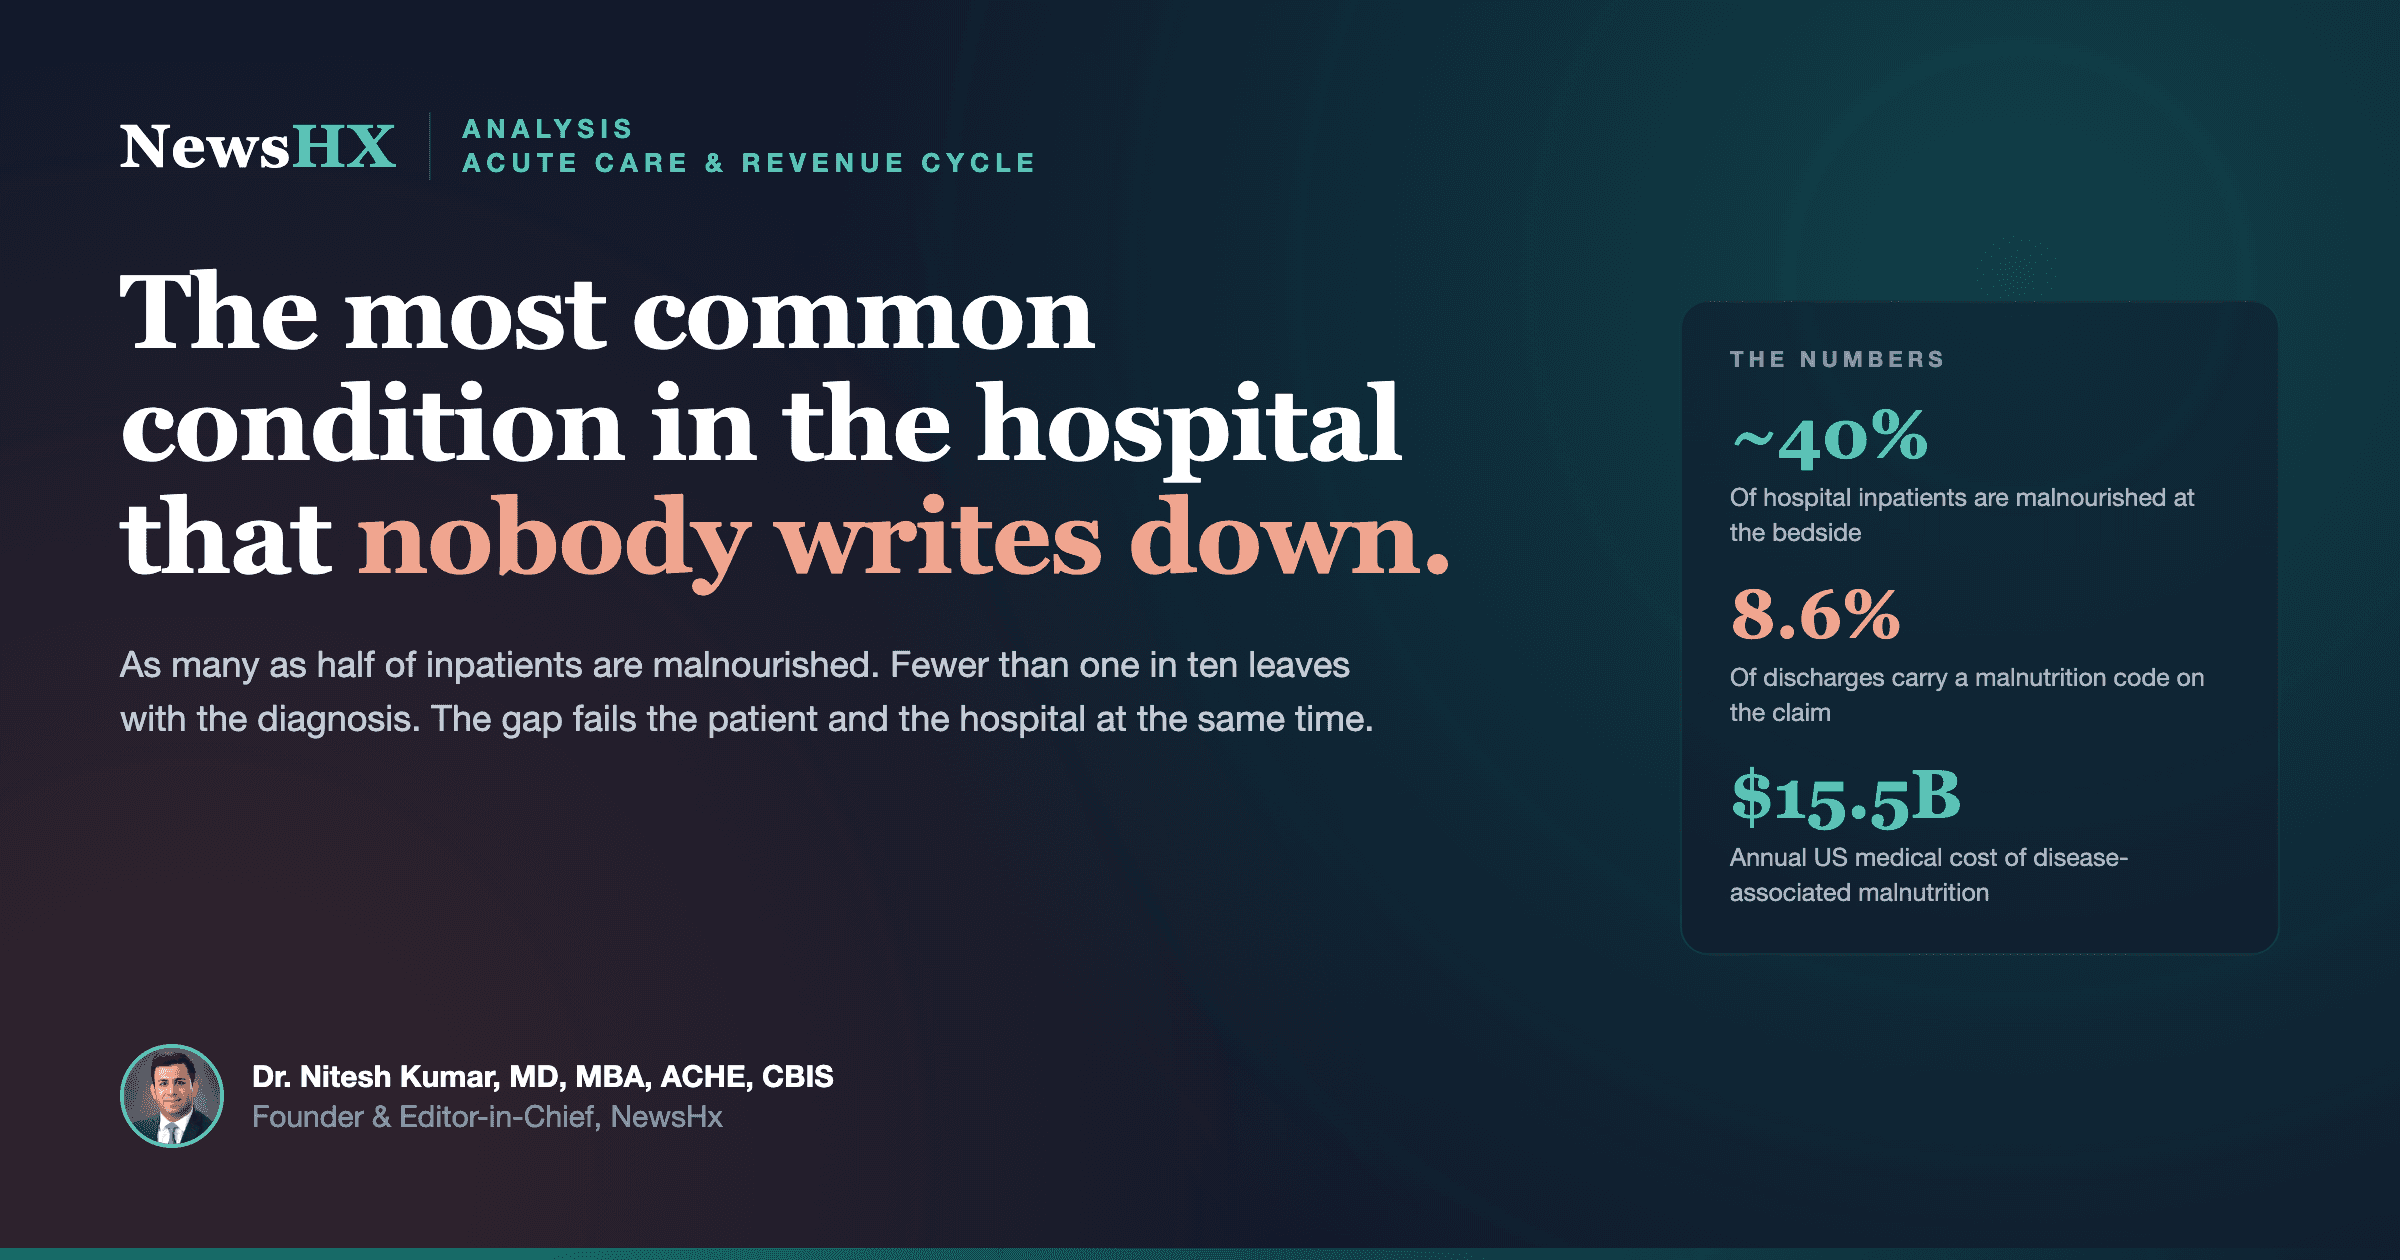
Malnutrition is the most common condition in the hospital that nobody writes down. The science was never the problem. The workflow is.
The gap, in two numbers
Start with prevalence. Using the Mini Nutritional Assessment, malnutrition runs at about 22 percent of hospital inpatients, and using the newer GLIM criteria the figure reaches roughly 50 percent among patients who are hospitalized, have cancer or heart failure, or sit in geriatric rehabilitation 1. A widely cited review of the acute setting puts typical hospital prevalence near 40 percent 2. Call it, conservatively, a fifth to a half of the ward.
Now the coding. In the most-cited national analysis, only 3.2 percent of all US hospital discharges in 2010 carried a malnutrition diagnosis code 3. Coding has since improved, and this is the number that reframes the story: a national study of discharges from 2016 to 2019 found any malnutrition code rose from 6.6 percent to 8.6 percent, and severe-malnutrition codes from 3.3 percent to 4.7 percent 4. That is a real trend line, a roughly 50 percent increase in four years. It is also, held against a bedside prevalence of 20 to 50 percent, a rounding error. After a decade of effort, the hospital is documenting the condition in fewer than one patient in ten while it walks the wards in as many as one in two.
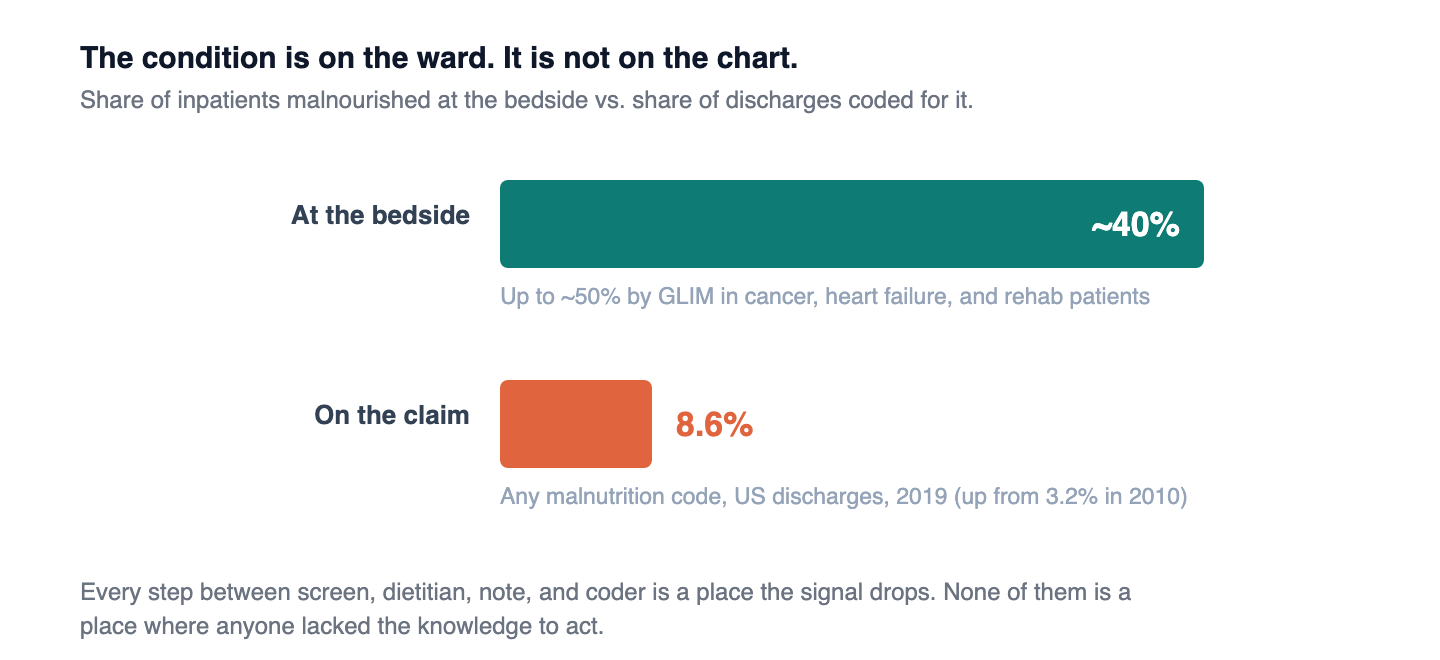
Bedside prevalence: one in five to one in two inpatients. Documented on the claim: fewer than one in ten. The distance between those two numbers is the entire story.
Why it stays invisible
The reflex explanation is that clinicians do not know how to diagnose it. That is wrong, and the wrongness is important, because it points to where the fix actually lives.
The criteria are validated and consensus-backed. In 2012 the Academy of Nutrition and Dietetics and the American Society for Parenteral and Enteral Nutrition published diagnostic characteristics: malnutrition is present when a patient shows at least two of six findings, including insufficient energy intake, weight loss, loss of muscle mass, loss of subcutaneous fat, fluid accumulation, and reduced grip strength 8. In 2019 the Global Leadership Initiative on Malnutrition, endorsed by the major nutrition societies worldwide, published a two-step framework: screen every patient with a validated tool, then confirm with at least one phenotypic criterion (weight loss, low BMI, or low muscle mass) plus at least one etiologic criterion (reduced intake or disease-driven inflammation) 9. The instruments exist. They are not exotic.
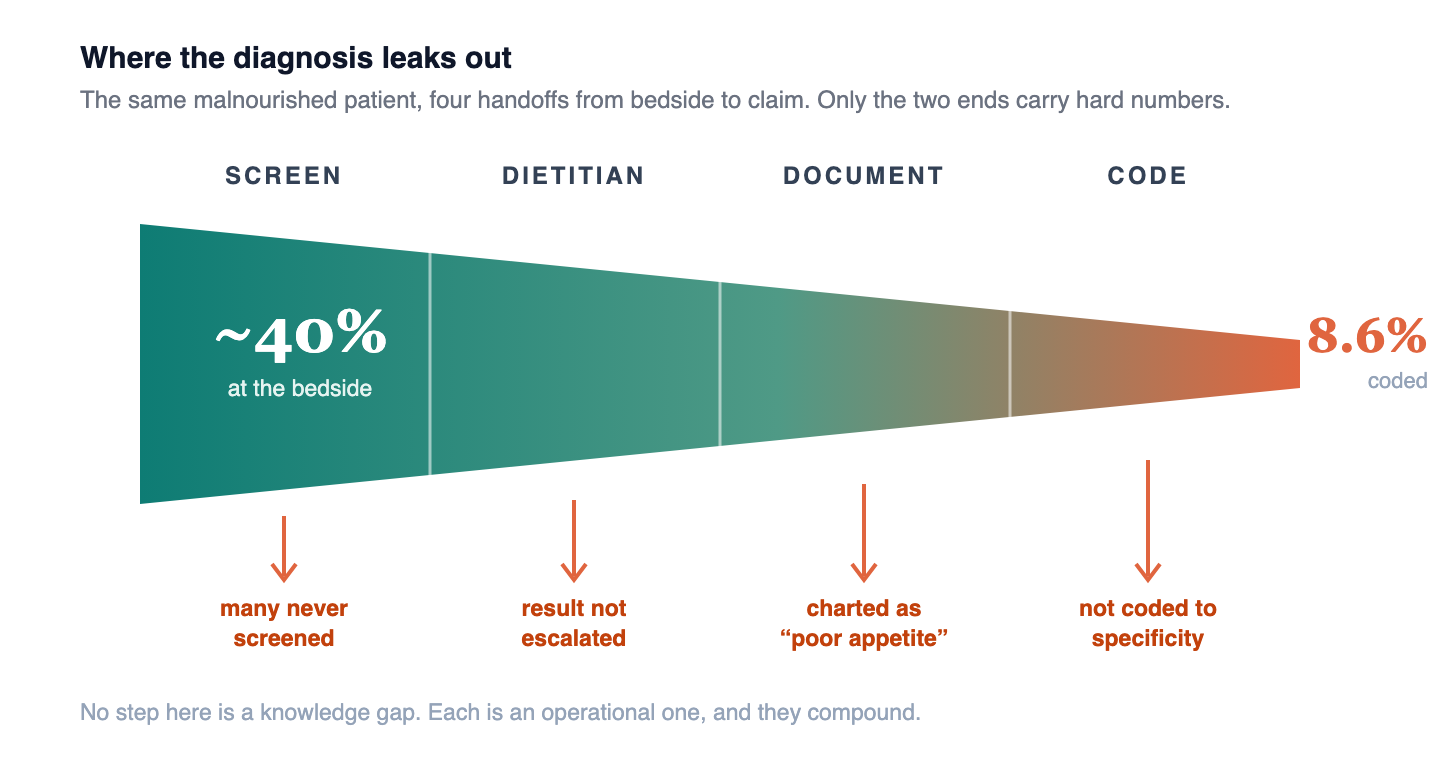
So the failure is not diagnostic literacy. It is operational. The NEJM review names the mechanism plainly: in hospitals, nutritional care is threatened by time and cost pressures as well as a lack of nutritional awareness among staff, and the condition is underdiagnosed and undertreated at all ages, a neglect serious enough that the World Health Organization issued a formal call for action in 2023 1. Screening happens or it does not. If it happens, the result reaches the dietitian or it does not. If the dietitian assesses, the physician documents the diagnosis in a way a coder can capture, or the note says poor appetite and the diagnosis evaporates. Every step is a place the signal drops, and none of them is a place where anyone lacked the knowledge to act.
The double cost: the patient and the hospital
Here is why the dropped signal is expensive, and it is expensive in two currencies at once.
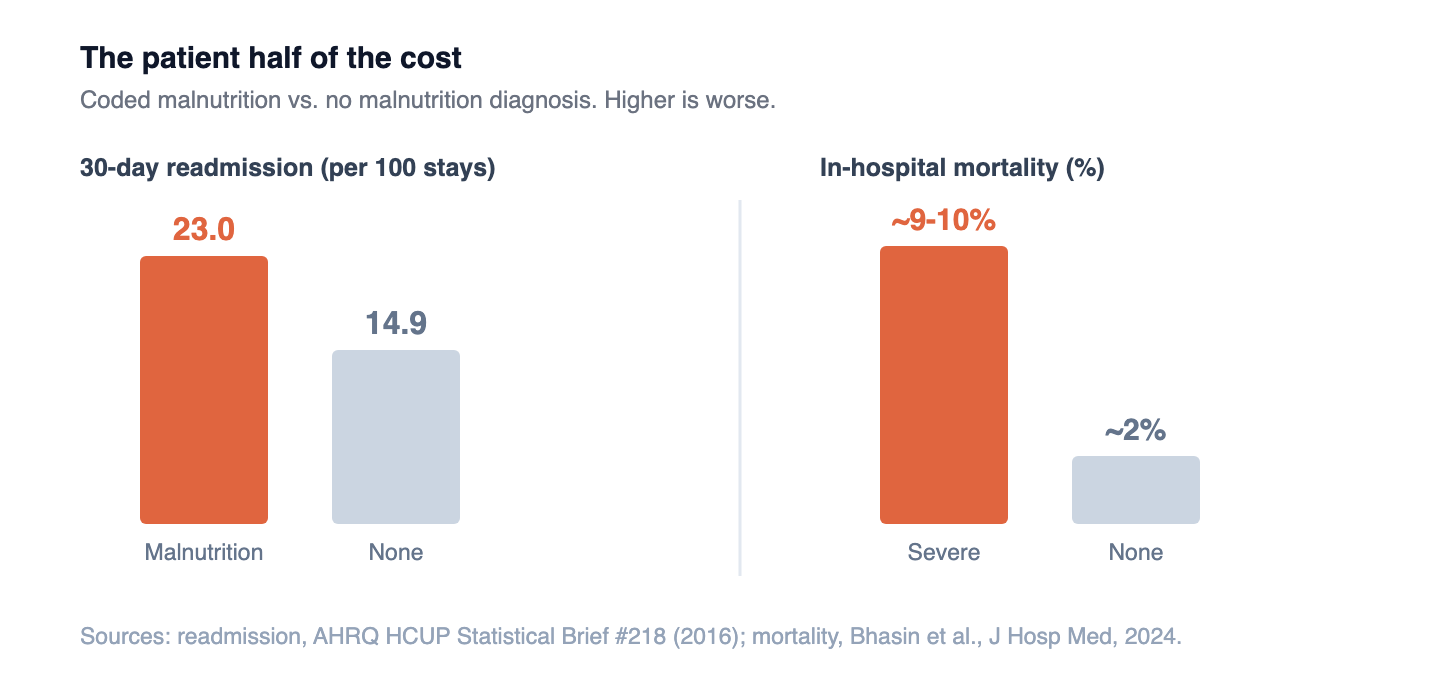
For the patient, malnutrition is not a cosmetic label. Patients discharged with a coded malnutrition diagnosis are older, stay longer, cost more, and are more than five times as likely to die in the hospital as patients without it 3. The more recent national data put in-hospital mortality among severe-malnutrition stays at roughly 9 to 10 percent, against about 2 percent for stays with no malnutrition diagnosis 4. And the condition follows the patient home: the 30-day all-cause readmission rate is 23.0 per 100 stays for malnutrition patients versus 14.9 for those without, more than 50 percent higher 7. At the population level, the direct medical cost of disease-associated malnutrition across eight common conditions has been estimated at 15.5 billion dollars a year 6. This is not a soft, quality-of-life diagnosis. It is a hard driver of the outcomes hospitals are measured and penalized on.
For the hospital, the same missed diagnosis is a revenue-cycle failure, and this is the half that operators underestimate. Under the Medicare inpatient prospective payment system, a documented severe protein-calorie malnutrition (ICD-10 E43) is classified as a major complication or comorbidity, an MCC, and moderate malnutrition (E44.0) as a complication or comorbidity, a CC 5. Adding a valid MCC or CC to a stay can move the case into a higher-weighted DRG, which is to say the hospital is paid more for the same admission because the patient's true complexity is finally on the record. When the diagnosis is present at the bedside but absent from the chart, the hospital has delivered the care of a sicker patient and billed for a healthier one. A review of the casemix mechanics makes the point directly: unidentified malnutrition results in foregone reimbursement the institution was entitled to 2.
A malnourished patient who is never documented costs twice. The patient gets a worse outcome. The hospital gets paid as if the patient were well. The same dropped signal empties both pockets.
The fix works, and we know because it has been tried
The strongest argument for closing the gap is that when hospitals close it, outcomes move. This is not theoretical.
The cleanest demonstration is a nutrition-focused quality improvement program run across four hospitals, built around an EMR-cued screen that flagged at-risk patients on admission and drove prompt oral nutritional supplements. It cut 30-day readmissions by roughly 18 to 22 percent against baseline, with length-of-stay reductions alongside 10. A budget-impact analysis of the same program found net savings of about 1,500 to 3,900 dollars per patient 13. A separate Malnutrition Quality Improvement Initiative across 27 hospitals found that older patients who received both a malnutrition diagnosis and a nutrition care plan had a 24 percent lower likelihood of 30-day readmission 12. And in the NOURISH randomized trial of malnourished older adults hospitalized with cardiopulmonary conditions, a specialized high-protein supplement was associated with a striking 90-day mortality reduction, 4.8 percent versus 9.7 percent 11.
I owe the reader a piece of fair balance here, because it sharpens rather than softens the point. NOURISH did not meet its primary composite endpoint; the mortality signal was a secondary finding, and it should be read as promising rather than definitive 11. And much of this intervention and economics literature is funded or co-authored by the nutrition industry, which does not invalidate the data but does mean it should be weighed with that disclosed. Even read conservatively, the direction is consistent across trial designs and sites: identify malnutrition, act on it, and readmissions and mortality fall. The intervention is a screen and a supplement. It is one of the cheapest levers in the building.
The new layer, and what it can and cannot do
This is where the automation enters, and where an operator has to be precise about what is being bought.
A new class of tools aims the recent advances in language models at exactly the dropped signal. The approach is straightforward: read the structured and unstructured chart in real time, weights and intake and nursing notes and prior history, surface the patients who meet phenotypic and etiologic criteria, auto-populate the dietitian consult, and prompt the physician and the coding team to document the diagnosis at the level of specificity that captures the MCC or CC. In effect, it automates the connective tissue that keeps failing.
The mechanism is credible precisely because its low-tech ancestor already has evidence behind it. The four-hospital program above worked off an EMR-cued screen, a rules-based nudge, not artificial intelligence 10. AI extends that from a rule to a reading of the whole record, which is a real capability gain. But the honest caveat, which vendors will not volunteer, is that there is not yet an independent randomized trial of an AI malnutrition-capture product. The company-reported figures circulating in the trade press are marketing, not evidence. The defensible claim today is narrower and still strong: the underlying mechanism, screen plus prompt plus act, is proven, and automation is a plausible and probably better way to execute it at scale. Buy it as an execution engine for a proven workflow, not as a proven product in its own right.
The catch: a code is not a calorie
And now the turn this piece exists to make, because the seductive version of the automation story is also the dangerous one.
Capturing the diagnosis and treating the patient are two different acts, and the economics of automation pull hard toward confusing them. The revenue-cycle case for these tools is immediate and quantifiable: a captured MCC changes a DRG this quarter. The clinical case, feeding the patient, is slower and lands in a different budget. A hospital that deploys detection to book the reimbursement and does not staff the dietitian, the supplement protocol, and the discharge nutrition plan on the other side has done something worse than nothing. It has coded a condition it did not treat, converting a clinical failure into a documented, audit-exposed one, and it has taught itself that the malnutrition problem is handled because the capture rate went up.
The evidence is unambiguous that the code is not the intervention. In the 27-hospital initiative, the readmission benefit attached to patients who got a diagnosis and a care plan, not to the diagnosis alone 12. The diagnosis is the trigger. The supplement, the mealtime assistance, and the plan are the treatment. Automation is very good at pulling the trigger. It fires nothing downstream on its own.
The reimbursement lands the quarter you capture the code. The patient benefit lands only if someone feeds them. A program that funds the first and skips the second has automated the billing and abandoned the medicine.
What this looks like from the bedside
I have spent most of my clinical career in the recovery lane, watching patients move from an acute event back toward a home that is supposed to hold them. Nutrition is where a surprising number of those recoveries quietly come apart, and it usually comes apart invisibly. The weight loss is in the chart as a number nobody totaled. The thin arms are in the exam nobody documented as muscle loss. The third-of-the-tray intake is in the nursing flowsheet nobody escalated. The patient was malnourished the whole admission, and the record will show a clean, well-nourished discharge, which is how the readmission three weeks later gets blamed on the pneumonia instead of the wasting.
That is the same failure the coding data and the outcomes data describe from two directions, which is why I read the automation wave as necessary and incomplete in the same breath. Making the invisible diagnosis visible is real progress, and getting paid correctly for the complexity you actually treated is not gaming the system, it is accuracy. But a captured code sitting on a claim does not put a supplement in the patient's hand or a plan in the discharge packet. For the sickest patients, the ones who fill these wards, the capture only matters if it triggers a treatment that actually happens.
What has to be true
So hold both facts. The documentation barrier is real and finally addressable, and closing it is worth doing on the merits, for the patient and the ledger both. And the documentation barrier is not the same barrier as the treatment gap, and a program that solves only the first will look successful on a dashboard while failing the people it counted. A serious malnutrition strategy solves for both, which makes it an operating model, not a coding project. Three things have to be true.
Screening has to be universal and the dietitian has to be resourced to act on it. GLIM begins with screening every patient, and the intervention evidence begins with a screen that reaches someone who can respond 9,10. Detection without dietitian capacity on the other end just generates alerts nobody can work. The registered dietitian is the person who converts a flag into a plan, and a program that automates the flag while starving the RD staffing has optimized the wrong end.
Documentation has to be designed to capture specificity, not just presence. The reimbursement difference between severe malnutrition as an MCC and moderate as a CC is real, and it rests on the physician documenting to the level the coder can defend against a denial 5. This is where clinical documentation integrity and automation genuinely help, and where it has to be built to withstand audit, because a captured MCC that cannot survive review is a liability, not revenue.
Someone has to own the treatment the code does not deliver. The supplement protocol, the mealtime assistance, the transition to home nutrition. These sit downstream of the diagnosis and outside the detection tool, and they are where the readmission benefit is actually earned 10,11,12. The captured code is the trigger. Provision of the nutrition is a separate line item, and a program that funds only the trigger will underperform and then blame the science instead of the design.
The bottom line
Malnutrition was always common, always consequential, and always diagnosable. What it lacked was a reliable way to move from the bedside to the record, and for the first time the tools to close that gap are arriving at scale. That is worth doing. The patient recovers better and the hospital is paid accurately for the sickness it actually treated, and those are the same act, not competing ones.
But finding the diagnosis and fixing it were never the same thing. A code on a claim is not a supplement in a hand or a plan in a discharge packet. The hospitals that win the next five years will treat the new tools correctly: as proof that the diagnosis is now findable, and as a reminder that finding it was never the same as fixing it. The capture is the easy half. The calorie is the hard one, and no algorithm has delivered that yet.
General information for clinicians and healthcare leaders, not clinical, financial, legal, or coding advice. Prevalence and coding figures reflect the cited national datasets and may not generalize to individual institutions. The E43 (MCC) and E44.0 (CC) designations were verified against the CMS ICD-10-CM/PCS MS-DRG v43.0 (FY2026) Definitions Manual and should be confirmed against the current fiscal-year manual before operational use. NOURISH did not meet its primary composite endpoint, and much of the nutrition-intervention literature carries industry funding or authorship, disclosed here as fair balance. No vendor is named in this piece, and NewsHX has no commercial relationship with any malnutrition-automation vendor.
Closing the malnutrition gap is an operating problem, not a coding project.
A3HCS helps health systems turn the malnutrition evidence into a real operating model: universal screening that reaches a resourced dietitian, documentation and CDI designed to capture MCC and CC specificity that survives audit, and the downstream supplement and discharge-nutrition protocols that actually earn the readmission benefit, so the captured code triggers a treatment that happens instead of a number on a dashboard.
References
- Cruz-Jentoft AJ, Volkert D. Malnutrition in Older Adults. N Engl J Med. 2025;392(22):2244-2255. doi:10.1056/NEJMra2412275
- Barker LA, Gout BS, Crowe TC. Hospital Malnutrition: Prevalence, Identification and Impact on Patients and the Healthcare System. Int J Environ Res Public Health. 2011;8(2):514-527. doi:10.3390/ijerph8020514
- Corkins MR, Guenter P, DiMaria-Ghalili RA, et al. Malnutrition Diagnoses in Hospitalized Patients: United States, 2010. JPEN J Parenter Enteral Nutr. 2014;38(2):186-195. doi:10.1177/0148607113512154
- Bhasin A, Huang L, Shieh MS, Pekow P, Lindenauer PK, Lagu T. Malnutrition in Hospitalized Adults in the United States, 2016-2019. J Hosp Med. 2024;19(12):1113-1121. doi:10.1002/jhm.13456
- Centers for Medicare & Medicaid Services. ICD-10-CM/PCS MS-DRG v43.0 (FY2026) Definitions Manual, Appendix C: Complications or Comorbidities. E40-E43 designated MCC; E44.0 designated CC. Accessed July 9, 2026. cms.gov/icd10m/FY2026-fr-v43-fullcode-cms
- Goates S, Du K, Braunschweig CA, Arensberg MB. Economic Burden of Disease-Associated Malnutrition at the State Level. PLoS One. 2016;11(9):e0161833. doi:10.1371/journal.pone.0161833
- Fingar KR, Weiss AJ, Barrett ML, Elixhauser A, Steiner CA, Guenter P, Brown MH. All-Cause Readmissions Following Hospital Stays for Patients With Malnutrition, 2013. HCUP Statistical Brief #218. Agency for Healthcare Research and Quality; December 2016. hcup-us.ahrq.gov/reports/statbriefs/sb218-Malnutrition-Readmissions-2013.pdf
- White JV, Guenter P, Jensen G, Malone A, Schofield M. Consensus Statement: Academy of Nutrition and Dietetics and American Society for Parenteral and Enteral Nutrition: Characteristics Recommended for the Identification and Documentation of Adult Malnutrition (Undernutrition). J Acad Nutr Diet. 2012;112(5):730-738. doi:10.1016/j.jand.2012.03.012
- Cederholm T, Jensen GL, Correia MITD, et al. GLIM Criteria for the Diagnosis of Malnutrition: A Consensus Report from the Global Clinical Nutrition Community. Clin Nutr. 2019;38(1):1-9. doi:10.1016/j.clnu.2018.08.002
- Sriram K, Sulo S, VanDerBosch G, et al. A Comprehensive Nutrition-Focused Quality Improvement Program Reduces 30-Day Readmissions and Length of Stay in Hospitalized Patients. JPEN J Parenter Enteral Nutr. 2017;41(3):384-391. doi:10.1177/0148607116681468
- Deutz NE, Matheson EM, Matarese LE, et al. Readmission and Mortality in Malnourished, Older, Hospitalized Adults Treated with a Specialized Oral Nutritional Supplement: A Randomized Clinical Trial (NOURISH). Clin Nutr. 2016;35(1):18-26. doi:10.1016/j.clnu.2015.12.010
- Valladares AF, Kilgore KM, Partridge J, Sulo S, Kerr KW, McCauley S. How a Malnutrition Quality Improvement Initiative Furthers Malnutrition Measurement and Care: Results from a Hospital Learning Collaborative. JPEN J Parenter Enteral Nutr. 2021;45(2):366-371. doi:10.1002/jpen.1833
- Sulo S, Feldstein J, Partridge J, Schwander B, Sriram K, Summerfelt WT. Budget Impact of a Comprehensive Nutrition-Focused Quality Improvement Program for Malnourished Hospitalized Patients. Am Health Drug Benefits. 2017;10(5):262-270. PMC5620506