


You are handed an itemized hospital bill. A day in a medical-surgical bed: $4,500. A CT scan of the abdomen: $9,000. A single dose of an ordinary IV drug, several hundred dollars. You do the multiplication in your head, and the number that comes out is obscene.
The instinct is correct, and the target is wrong. Almost no one pays that bill. The $4,500 is not what the day cost the hospital, and it is not what the hospital will be paid. It is a third thing.
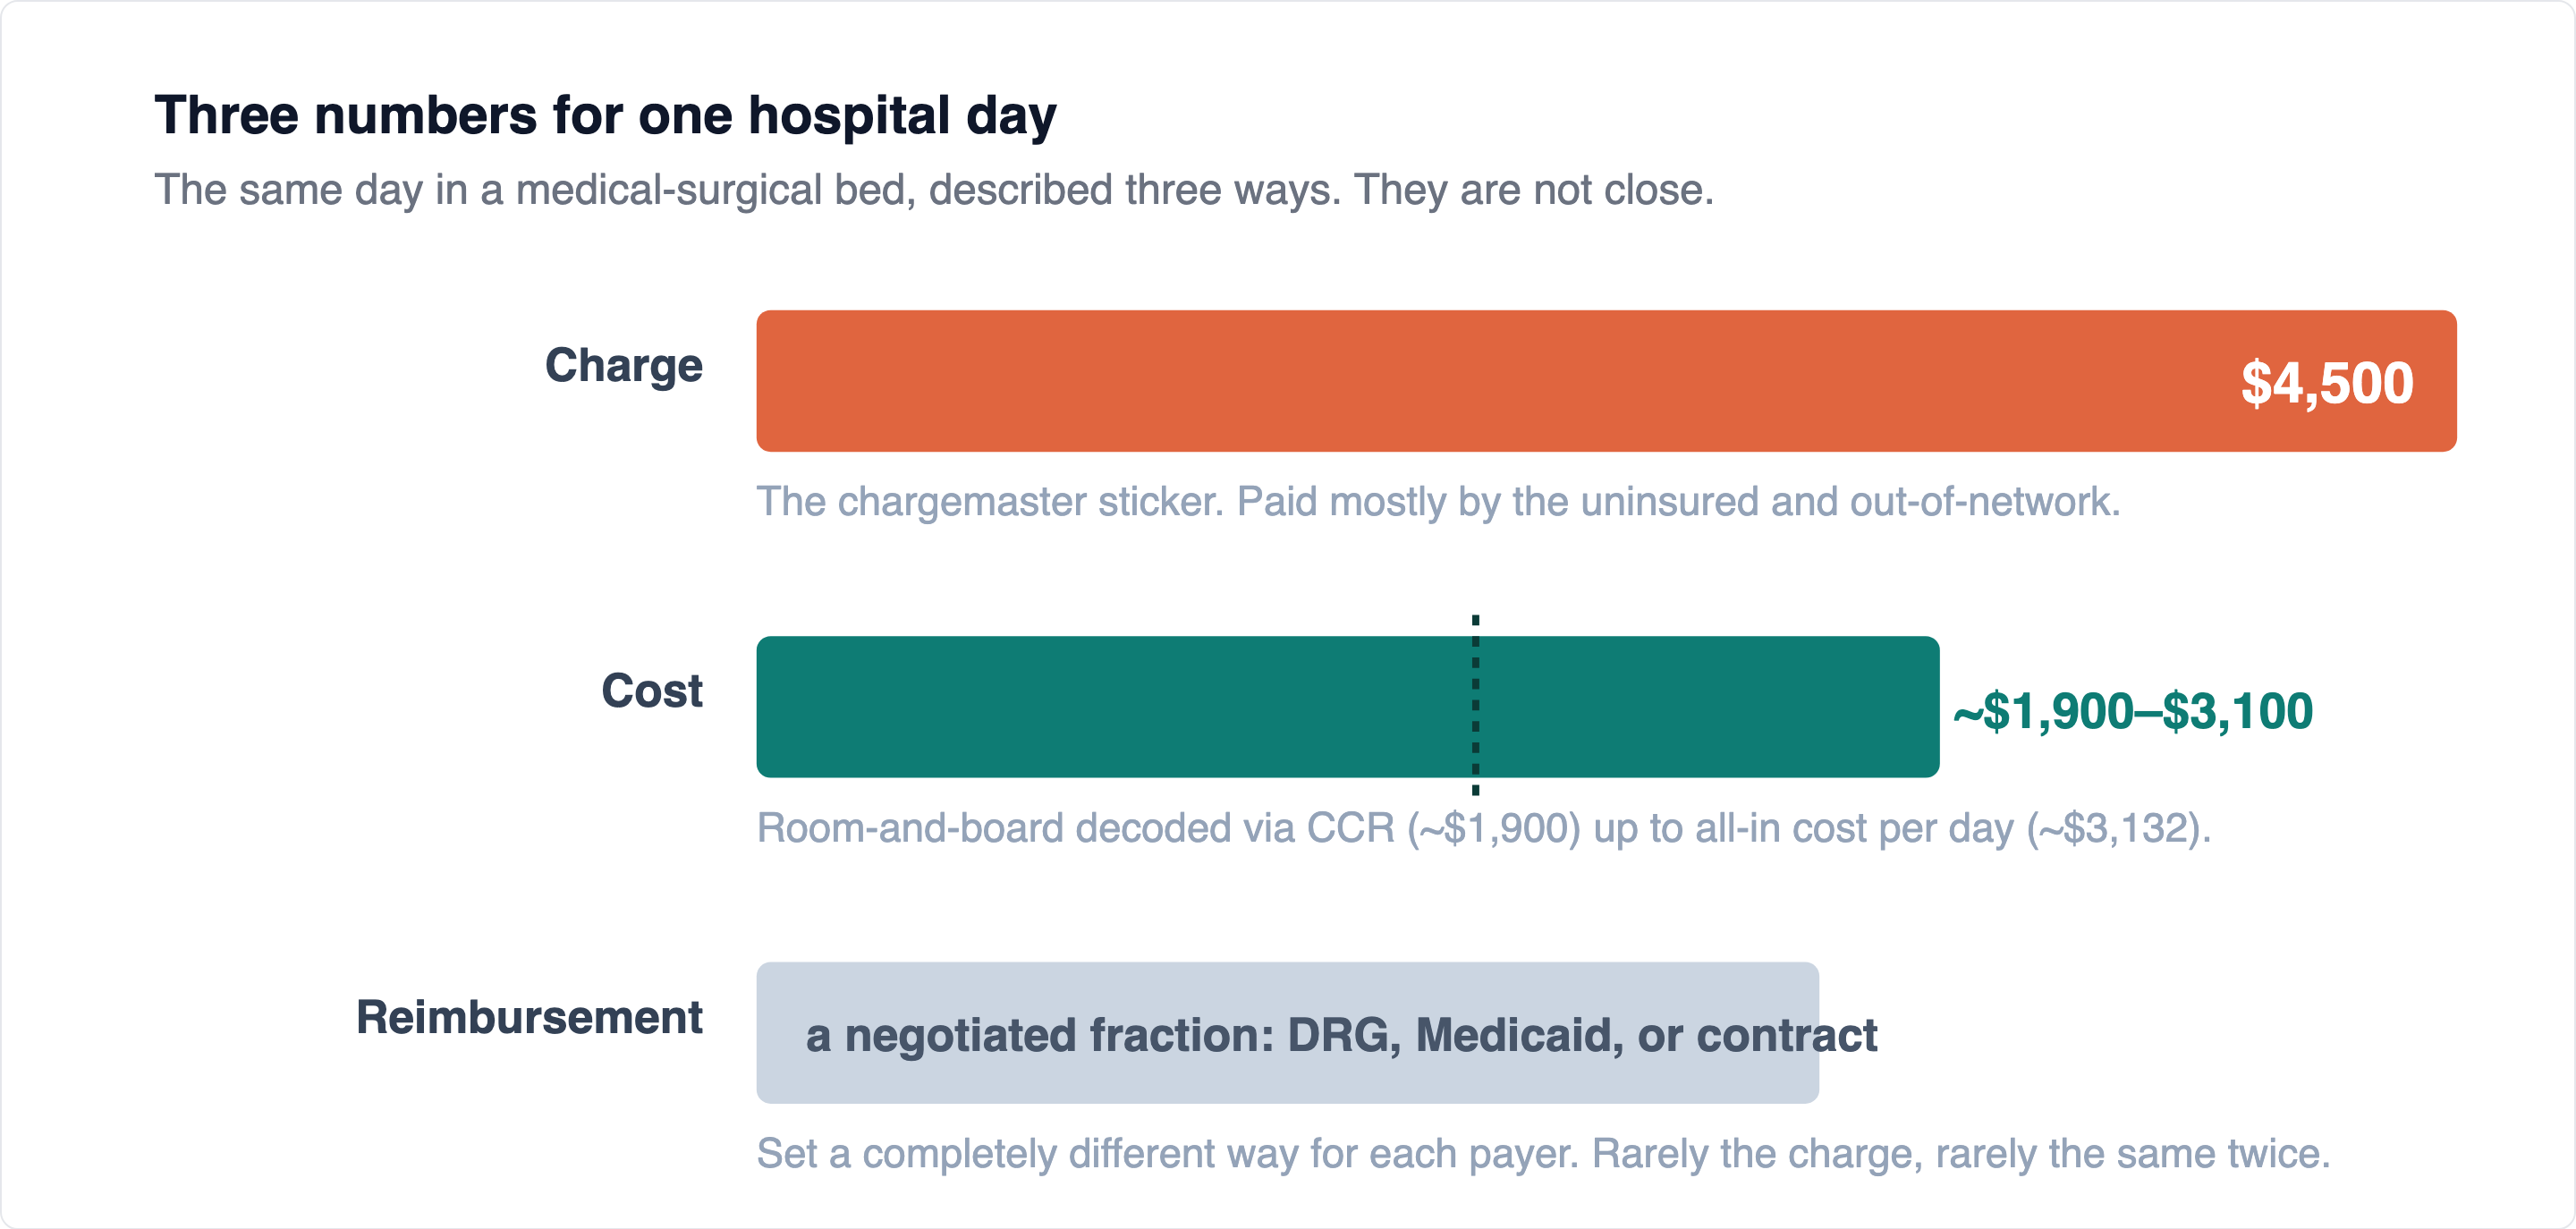
Three different numbers describe that single day in the bed, and in American health care they are allowed to drift miles apart. There is the charge, the sticker on the itemized bill. There is the cost, what it actually took the hospital to deliver the care. And there is the reimbursement, what somebody actually pays. The charge is the loudest of the three and the least meaningful. The cost is the quietest and the most important. The reimbursement is a negotiated fraction that depends entirely on who is paying.
The document that reconciles all three, and that almost nobody outside hospital finance has read, is the Medicare cost report. It is filed once a year. It is signed under criminal penalty. It decodes the sticker price, it builds next year's payment rates for the entire field, it reveals whether a hospital is structurally dying, it holds a meaningful part of the cure for one that is, and it has quietly become the control panel for tens of billions of dollars a year, which is why it is now a battlefield.
This is the guide to all of it. What the form is, how the arithmetic works, why Medicare stopped paying by the day in 1983, how to read the document as a diagnostic, how to work it as a recovery instrument, and what happens when a boring accounting schedule ends up controlling real money.
A hospital bill is the most confidently precise document in American life that also happens to be fiction. Three numbers govern one hospital day, and they are not close.
Part I. What the cost report actually is
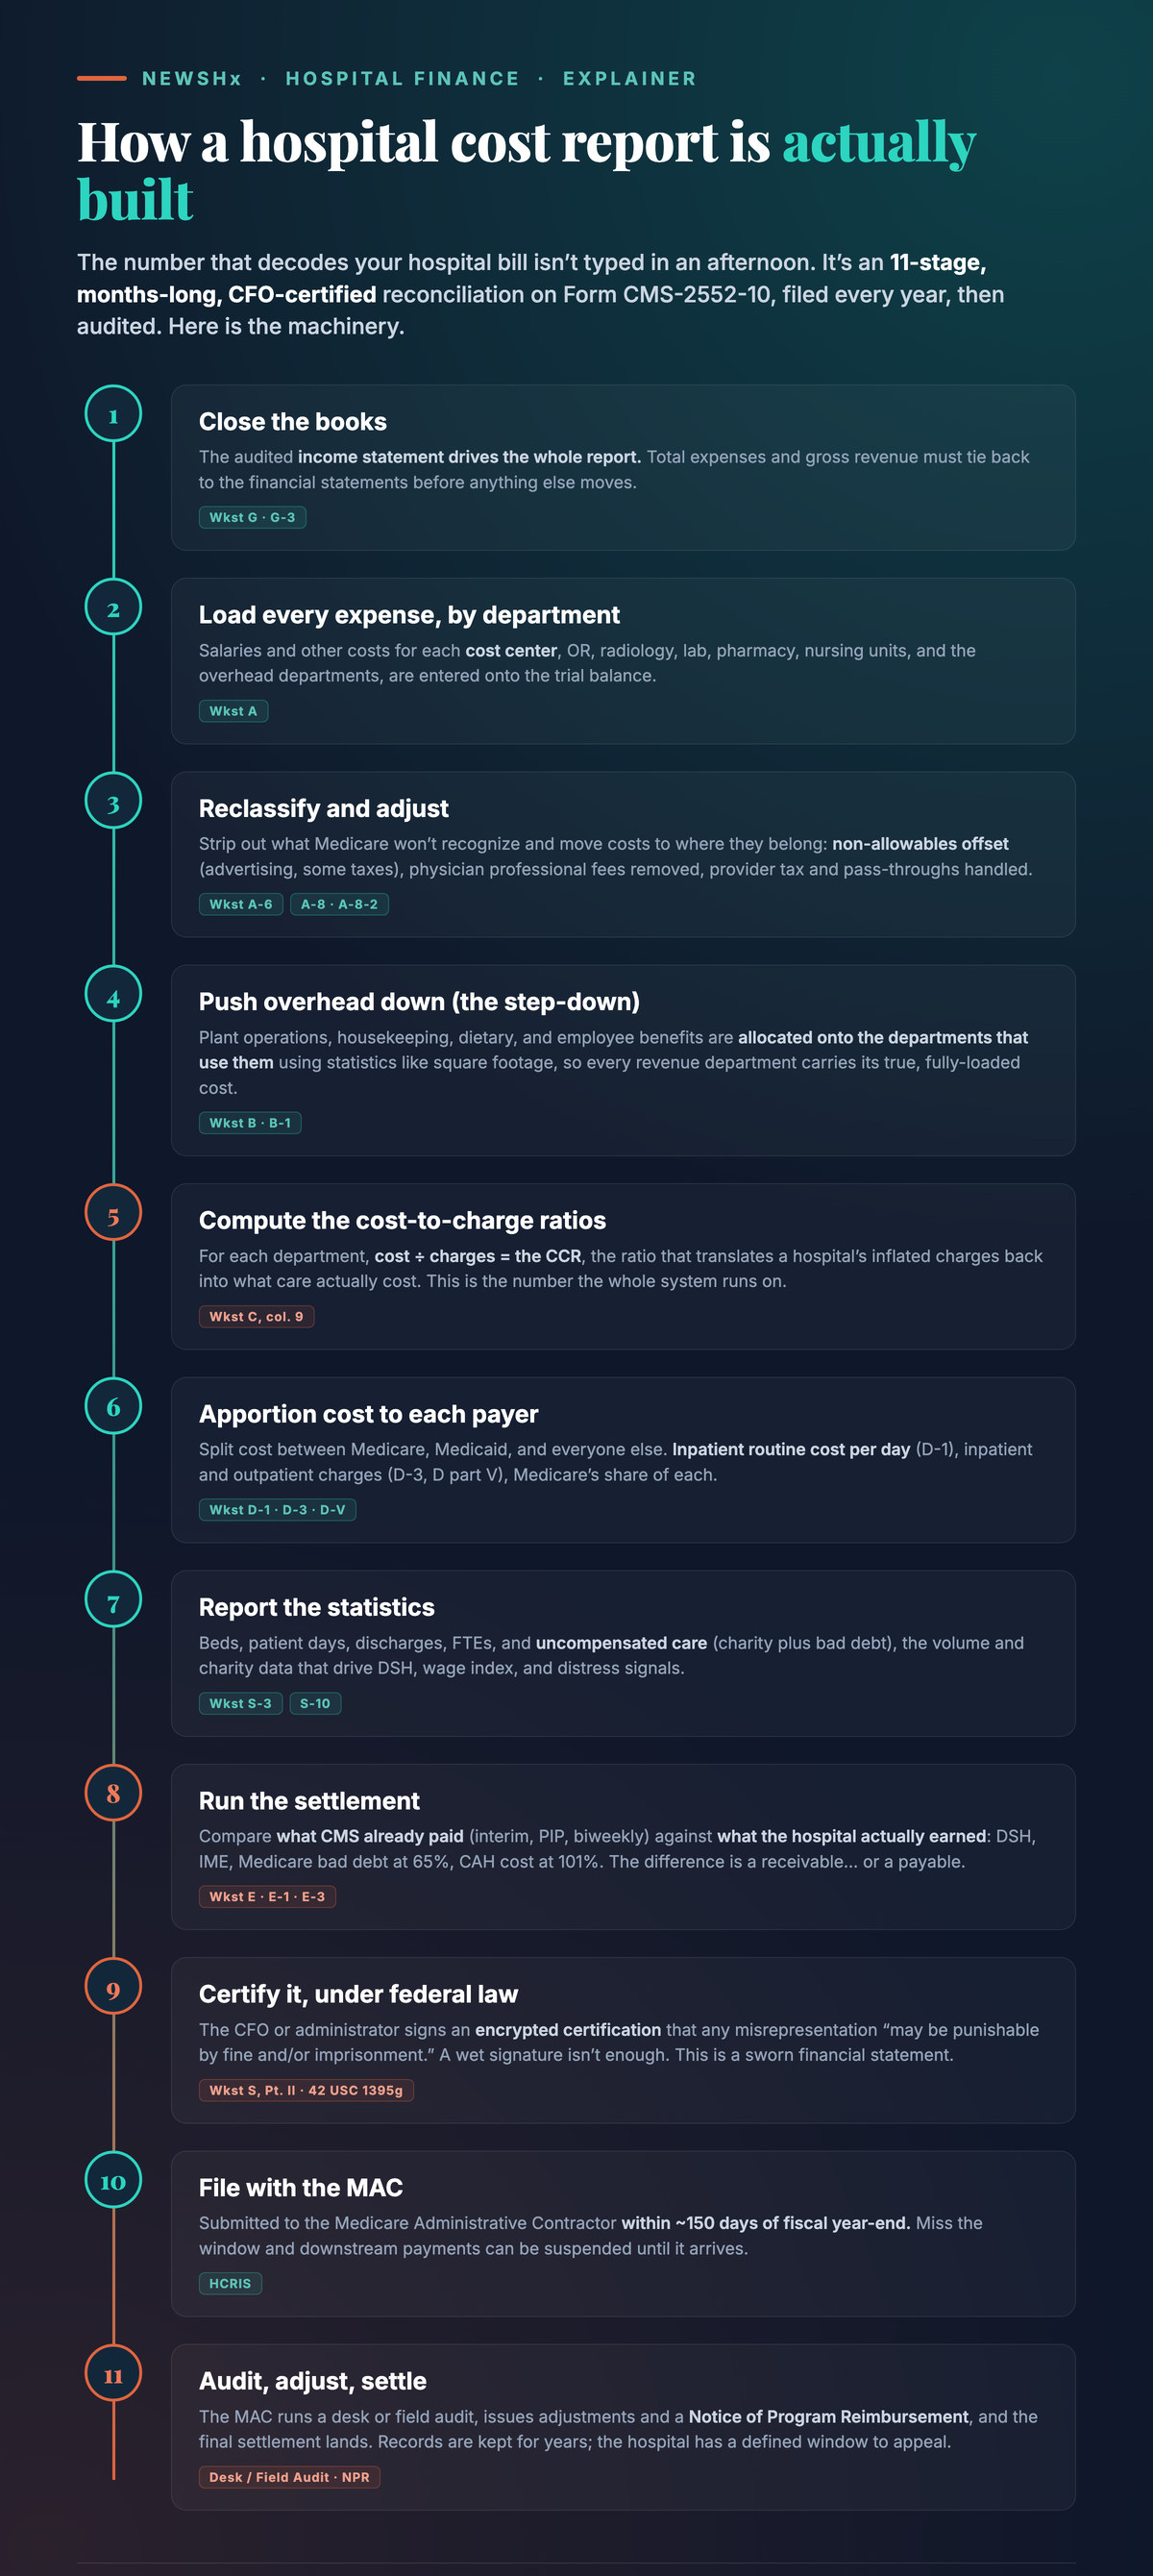
Every hospital that participates in Medicare files an annual report to its Medicare Administrative Contractor on Form CMS-2552-10, generally within five months of the close of its fiscal year 1,2. It is not a bill. It is not a tax return. It is a standardized reconciliation of what the hospital spent against what it charged, department by department, so the federal government can determine its fair share of the hospital's actual costs 3.
A few structural facts change how you read everything that follows. The audited income statement drives it. Expenses on the report's first working schedule must reconcile back to the hospital's audited financial statements, and the report even contains its own balance sheet and income statement 4. This is not a parallel set of books. It is the real ones, rearranged into the government's categories.
Cost flows downhill through a step-down. Overhead departments, plant operations, housekeeping, dietary, employee benefits, are allocated onto the revenue-producing departments that consume them, through a sequence called the step-down allocation 4. That mechanical detail matters more than it sounds, and we will come back to it. Each department then gets a ratio. For every ancillary cost center, the report computes total cost divided by total charges. That number is the cost-to-charge ratio, and it is the translation key between the two languages of hospital finance 4.
It ends in a settlement. A dedicated worksheet computes the difference between what CMS already paid the hospital during the year through interim payments and what the hospital actually earned. The result is a receivable or a payable, and people misread it: a payable does not mean the hospital is in bad financial health 4. It means the interim payments ran ahead of the earned amount.
It is signed, and the signature carries criminal weight. The CFO or administrator certifies the report with a statement printed on the form itself: misrepresentation or falsification "may be punishable by fine and/or imprisonment under federal law" 2. Late filing has teeth too. Under the Medicaid rules that ride on the Medicare report, failure to file within 150 days lets a state suspend payment until it arrives 5. Finally, it is public. The data land in the Healthcare Cost Report Information System, which is how MedPAC, researchers, and journalists compute hospital margins, markups, and distress 3.
The chargemaster is marketing. The cost report is a sworn financial statement, signed by the CFO under penalty of federal law. One of those two documents is where the real number lives.
It helps to see the whole job description before the mechanics, because the form is load-bearing in five separate ways. It sets tomorrow's prices, for everyone. Under the inpatient and outpatient prospective payment systems, CMS builds future payment rates from average costs, and derives those costs by multiplying past hospital charges by the applicable ratio 6. Because rate-setting pools data across hospitals, one hospital's reporting affects every hospital's rates. The Medicaid instructions that ride on the Medicare report say it without euphemism: the costs and statistics reported will affect the rate for other providers as well as the reporting provider 5.
It is the authoritative record of what care costs. Payments are not costs. Medicare payments include policy adjustments not directly related to the cost of providing care, and the health services literature finds that costs calculated from the cost report using cost-center-specific ratios reflect true hospital cost more accurately than payments do 3. It gates designations and supplemental dollars. Eligibility for a stack of programs is read directly off this filing: 340B covered-entity status, disproportionate-share payments, uncompensated-care payments, Sole Community Hospital, Medicare-Dependent Hospital, Rural Referral Center, Rural Emergency Hospital, graduate medical education, and the wage index 2,4.
It is the settlement engine for everything still paid on a cost basis: critical access hospitals at roughly 101% of Medicare cost, Medicare bad debt at 65%, rural health clinic and FQHC cost-per-visit 4. And it is the public dataset behind essentially every credible number anyone quotes about hospital finances 3.
Part II. Decoding the bill: charge, cost, and the ratio between them
Every hospital keeps a master price list, the chargemaster, with a charge for every billable item, from a bag of saline to an hour in an operating room. Under CMS price-transparency rules these lists are public, and reading one is a lesson in how untethered a charge can be from reality.
The numbers are not calibrated to cost. Across US hospitals, charges run on average about 3.4 times the underlying cost, and the distribution has a long, ugly tail: for-profit hospitals average closer to 6 times cost, and the fifty highest-markup hospitals in the country charge roughly 10 dollars for every 1 dollar of cost 7. A charge is not exactly a lie. It is a starting position, inflated on purpose because a handful of payers, the uninsured, the out-of-network, the casualty and lien cases, actually get billed off it, and because for decades it served as the opening bid in negotiations with insurers.
So the $4,500 room-day is real the way a car's sticker price is real. It is printed, it is precise, and it is the number almost nobody pays. The people who do pay it are, cruelly, the ones least able to, which is its own scandal and a different article. For everyone else, the charge is discarded almost the moment it is generated and replaced by a payment set a completely different way.
Divide a department's cost by its charges and you get a number between zero and one. The lower the number, the bigger the markup 6. A ratio of 0.33 means a 3x markup. A ratio of 0.25 means 4x. CMS publishes national average ratios by department, and the spread is the tell. For fiscal year 2024 they run from 0.033 for CT scans to 0.417 for routine room-and-board days, with blood and blood products at 0.245 6. A ratio of 0.417 means the routine day is charged at about 2.4 times its cost. A ratio of 0.033 means a CT scan is charged at roughly 30 times its cost.
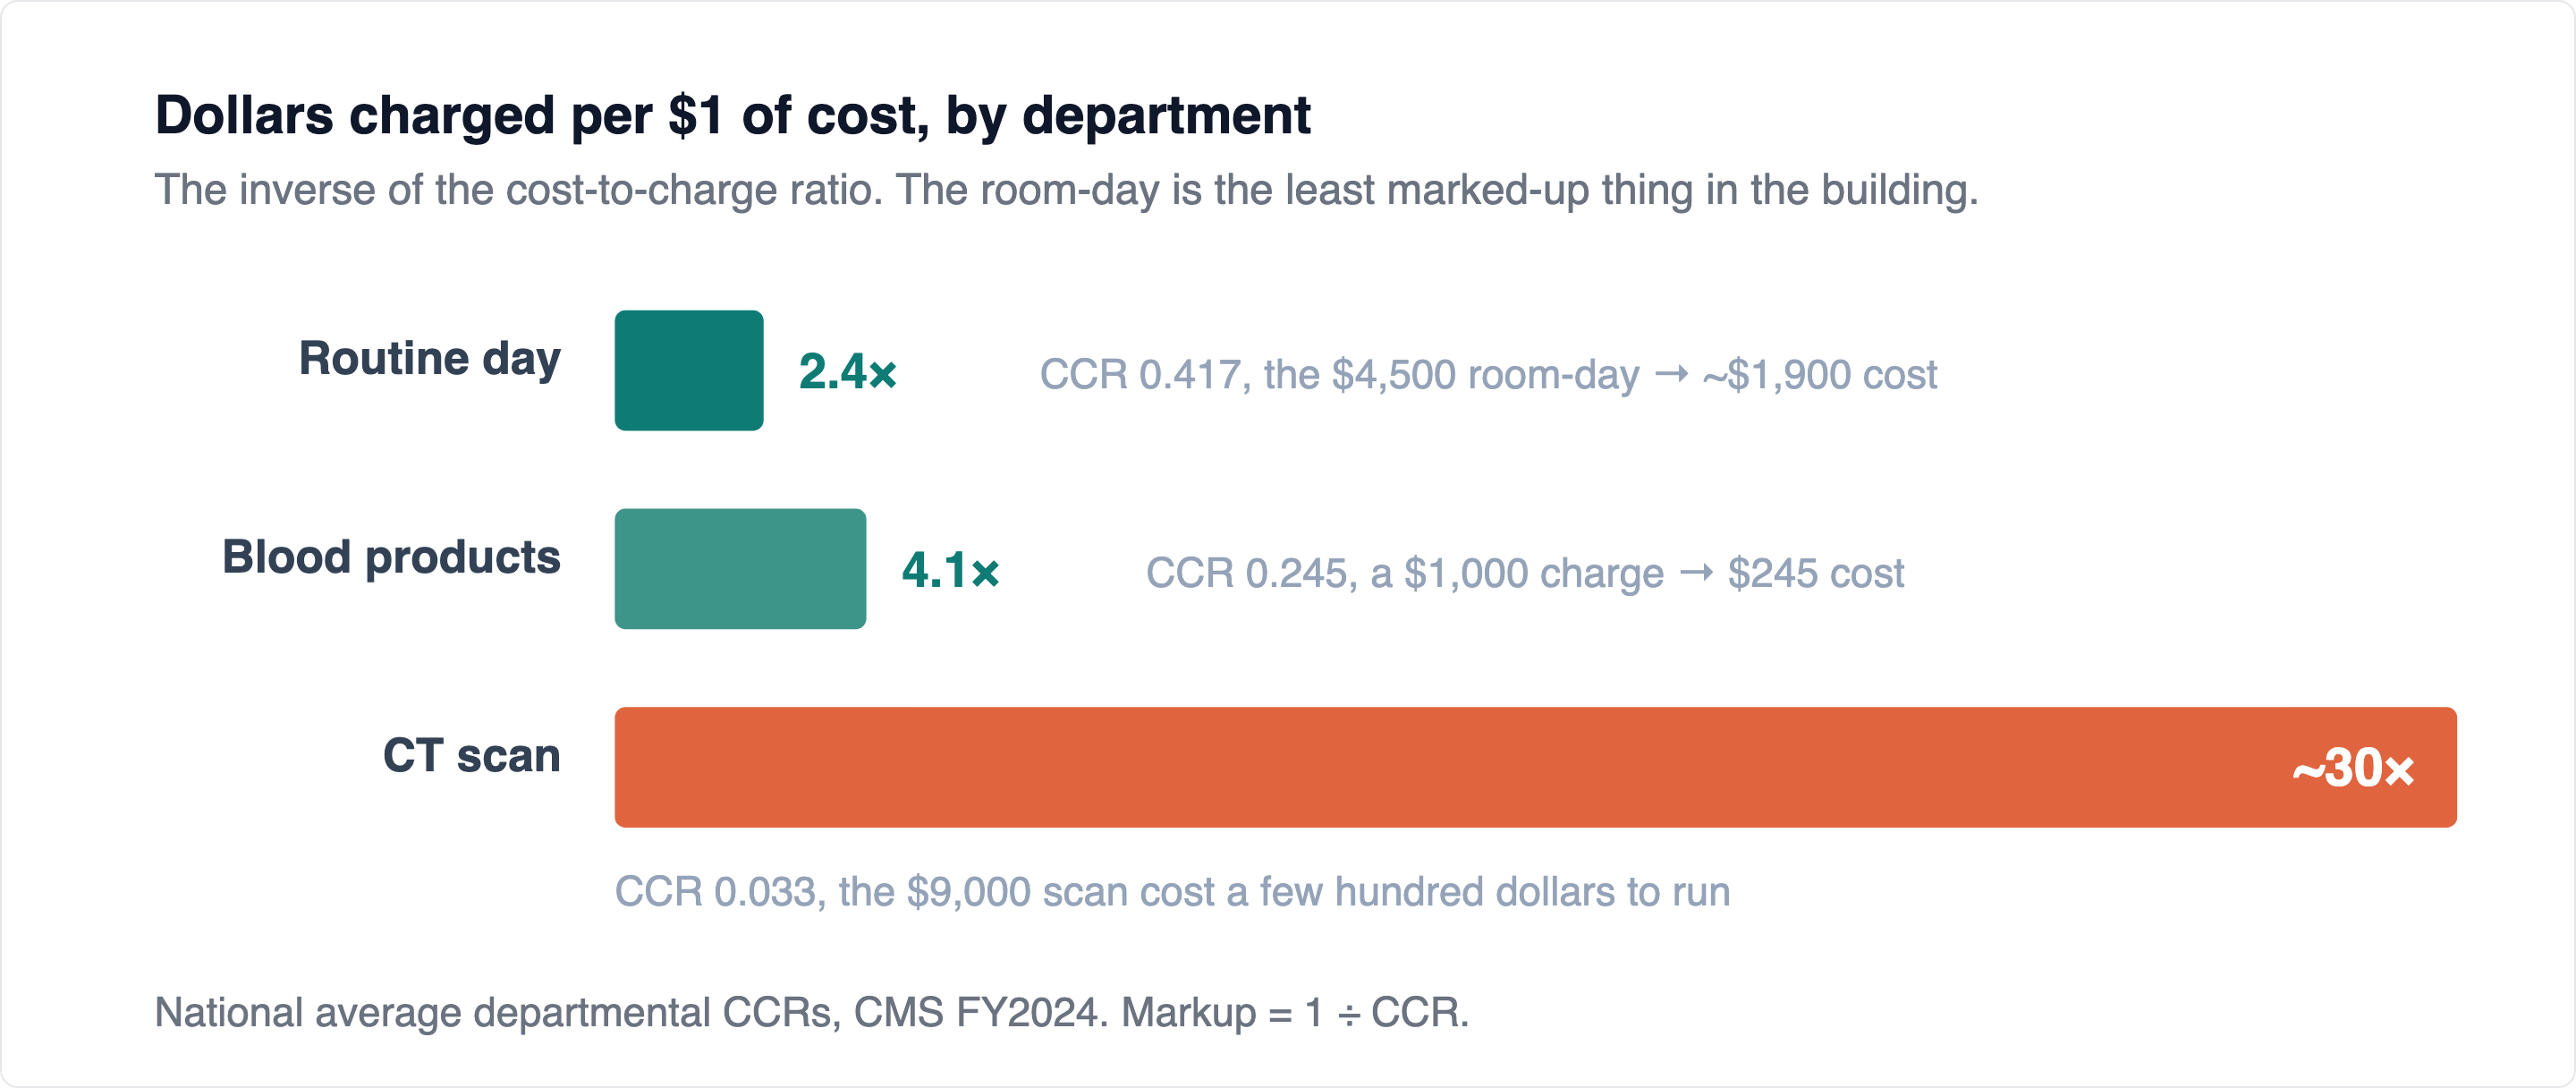
Note what that does to the popular story. Routine room-and-board days are the least marked-up thing in the building. The eye-watering multiples live in the ancillaries, in imaging and lab and pharmacy, which is exactly where an itemized bill looks most absurd.
Now decode the bill. That $4,500 room-day, run through the national routine ratio of about 0.417, reflects an underlying room-and-board cost closer to $1,900 6. The $9,000 CT scan, at a ratio near 0.033, cost the hospital a few hundred dollars to actually perform. CMS does this arithmetic in its own rule-making with a plain example: a $1,000 charge multiplied by a ratio of 0.245 yields a cost of $245 6.
There is a second, blunter way to see cost, and it lands in the same neighborhood. Strip out the chargemaster entirely and ask what a day of inpatient care actually costs a hospital to produce, all in, nursing and overhead and an allocation of everything else. The national average adjusted expense per inpatient day in 2023 was about $3,132, ranging from roughly $2,500 at for-profit hospitals to $3,300 at nonprofits 8. That figure is explicitly a cost estimate, not a charge and not a payment. It sits well below the $4,500 sticker and above the ratio-decoded room cost, because it folds in all the ancillaries the room charge does not. Whichever way you approach it, the sticker is not the cost. And neither of them is the payment.
The $4,500 room-day, decoded through the cost report, reflects a cost closer to $1,900. The CT scan charged at $9,000 cost a few hundred dollars to run. The charge was never the cost. The cost report is how you tell them apart.
Here is the part that makes the chargemaster more than a curiosity. The fictional charges are not discarded. They are the raw material CMS uses to set the real prices. Charges feed cost, cost feeds rates, and rates feed everyone. That is why accuracy in an obscure annual filing matters more than the eye-catching sticker: the charge and the ratio together are the inputs that become next year's rates for the whole field 5,6. The theater is the foundation.
Part III. Why Medicare does not pay by the day, and has not since 1983
Everything so far explains why the daily charge is not the cost. There is a deeper reason it is fiction, at least for the largest payer of inpatient care in the country: Medicare will not pay any of those line items, and has not paid that way since 1983. It pays one number, fixed in advance, for the whole admission, and that number has almost nothing to do with the days or the items on the page. That number comes from a classification system with a bland name and an outsized influence: the Diagnosis Related Group, or DRG.
The DRG did not begin as a payment tool. It began at Yale University in the late 1960s, and its original purpose was to monitor the quality of care and the utilization of services, to create a way of grouping patients so you could compare how they were treated 9. The problem it solved was definitional. Hospitals had always insisted that some of them cost more because they treated a sicker, more complex mix of patients, but nobody could measure the claim, because case-mix complexity had no operational definition 9. The DRG gave it one. It was, first, a measuring instrument.
Then it was conscripted. In the late 1970s New Jersey became the first state to use DRGs to actually pay hospitals, reimbursing a fixed DRG-specific amount per patient treated 9. In 1982 the Tax Equity and Fiscal Responsibility Act added a case-mix adjustment based on DRGs, and in 1983 Congress amended the Social Security Act to create a national DRG-based prospective payment system for all Medicare patients 9. In the space of a few years, an academic classification scheme became the basis on which the largest health-care payer in the country pays for inpatient care. It still is, having grown to 761 payment groups built from more than 72,000 diagnosis codes 9.
The word that matters in that 1983 law is prospective. Before it, Medicare paid hospitals retrospectively, based on the costs they reported after the fact, which meant more days and more services produced more payment. The incentive was to do more. DRGs inverted that completely. Medicare now decides the price of an admission in advance, based on the patient's DRG, and pays that fixed amount regardless of what the hospital's actual costs turn out to be 10.
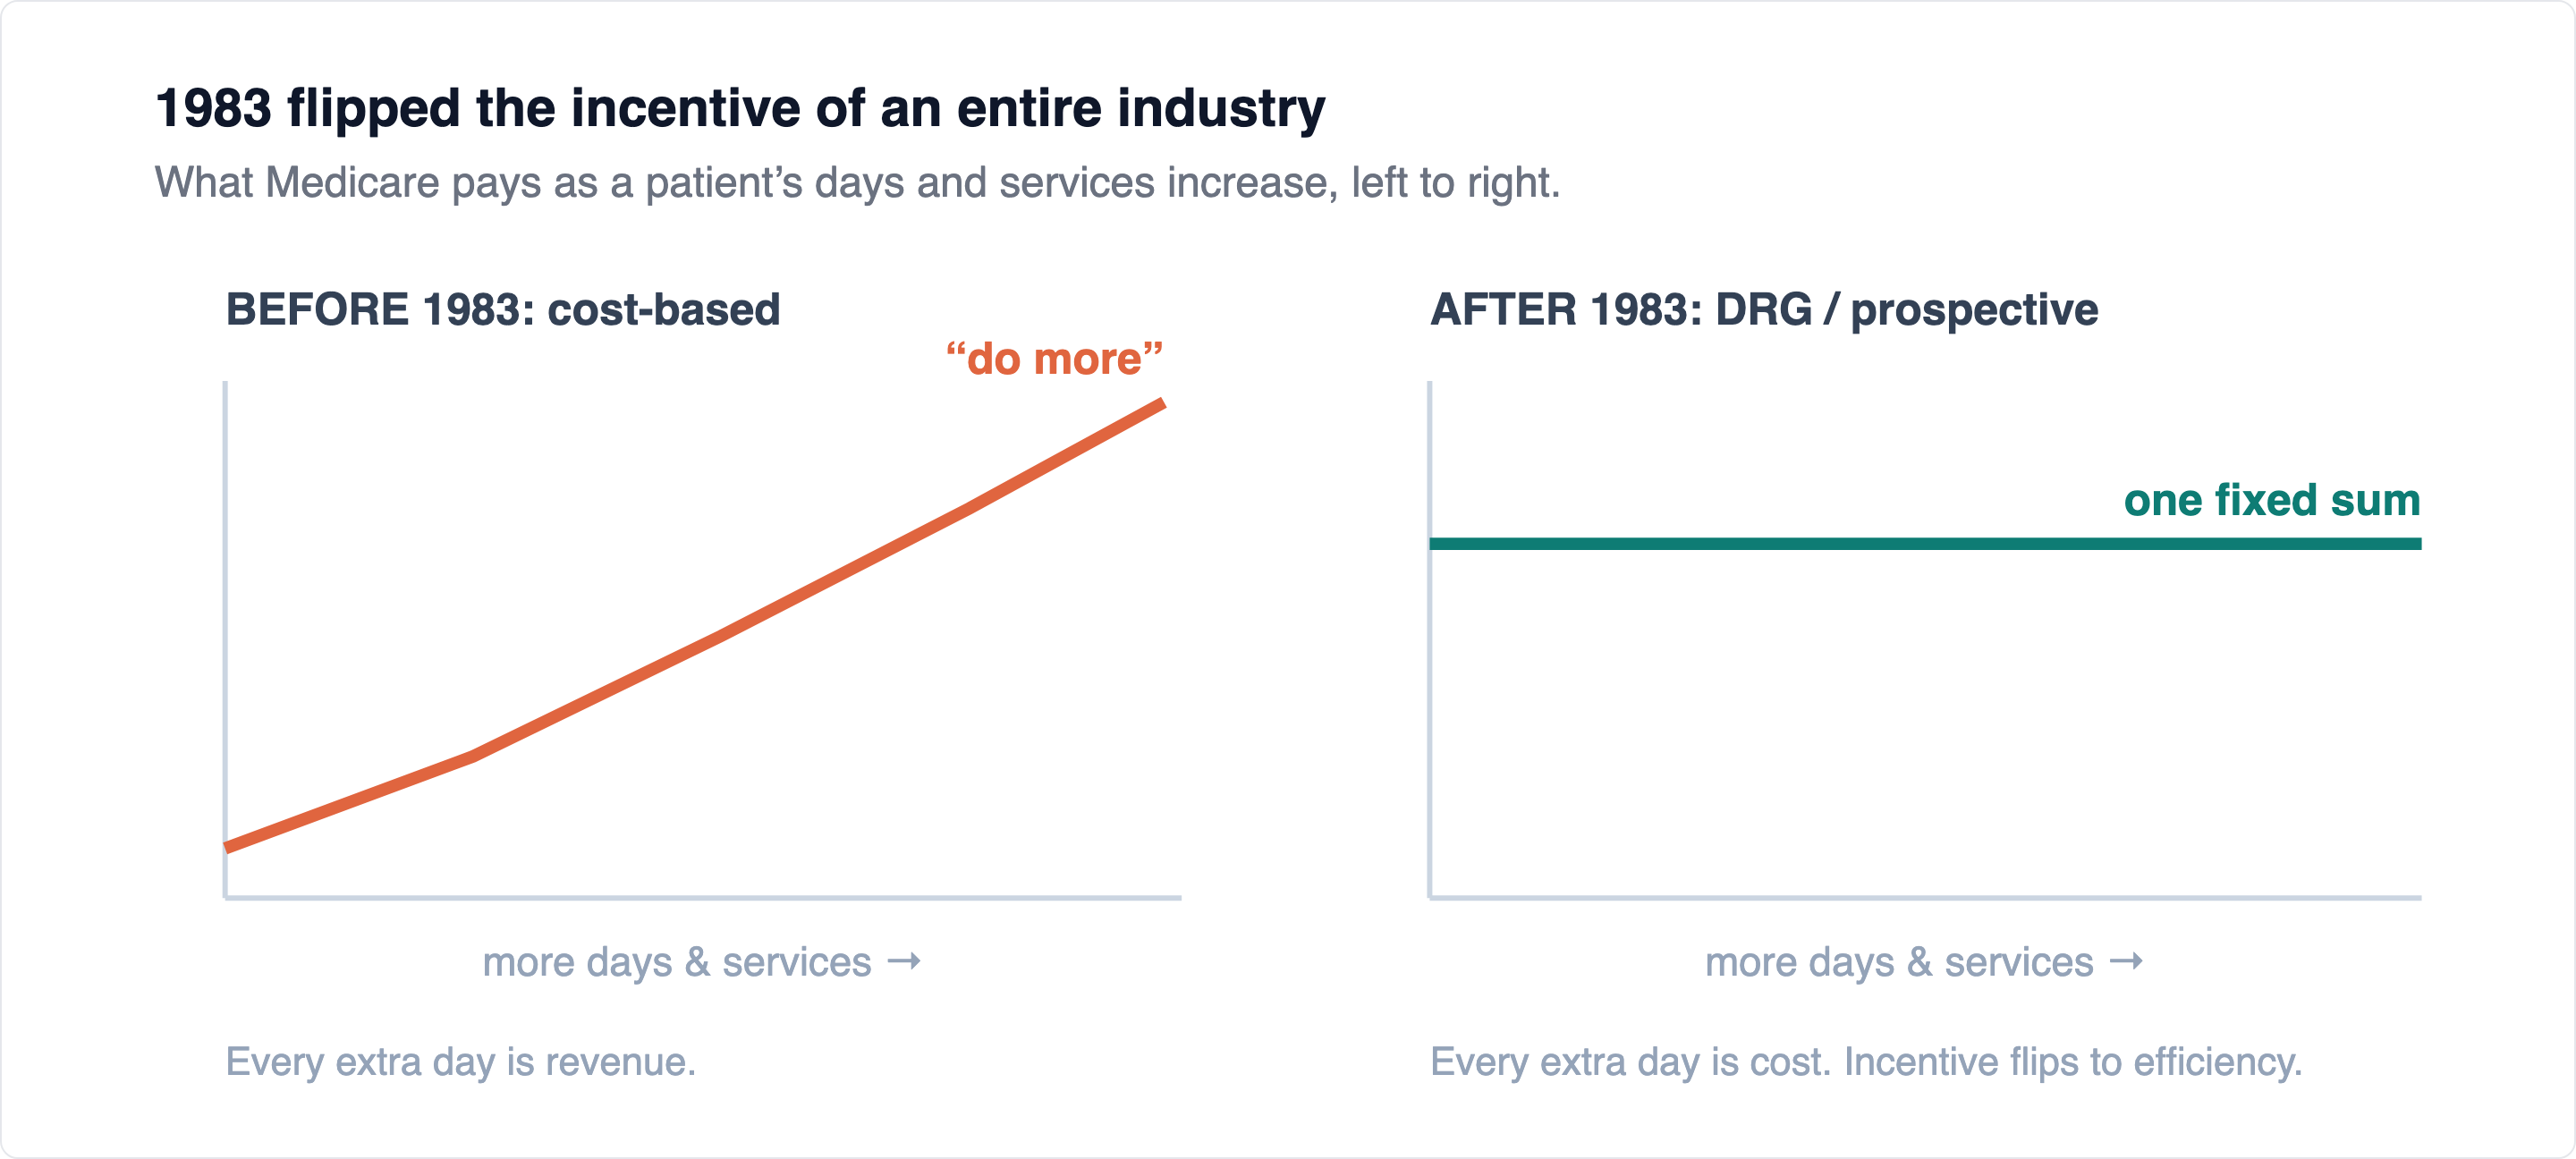
Sit with what that does. If the hospital treats the patient for less than the DRG payment, it keeps the difference. If it spends more, it eats the loss. Overnight, the incentive of an entire industry flipped from do more to do it efficiently, because the extra day and the extra test stopped being revenue and became cost. This is why length of stay collapsed after 1983, why discharge planning became a discipline, and why the daily charge is decorative for Medicare inpatients. The payment does not depend on the number of days. The meter is running for show.
Here is the part almost everyone gets wrong, including clinicians. When people hear that a hospital has a complex case mix, they assume the patients are sicker, more severely ill, worse prognoses. That is the clinical meaning of complexity. It is not what the DRG measures. The DRG measures resource intensity, the volume and cost of services a patient consumes, which is related to severity but is not the same thing 9. The source document that defines the system is blunt about the gap, with an example that stays with you: a terminal cancer patient is extremely severe with a dire prognosis, but may require few hospital resources beyond basic nursing care 9. Clinically, one of the sickest patients in the building. From the DRG's perspective, not complex at all, because complexity here means resource-hungry, not gravely ill.
A hospital with a high case-mix index is not necessarily treating sicker people. It is treating people who consume more billable resources. Those usually move together. The cases where they diverge are exactly where the arguments about hospital cost get interesting.
Now the mechanism that turns all of this into dollars, and turns a medical record into a revenue document. A patient's DRG is not assigned by a biller pulling a number from the air. It is built, step by step, from what is written in the chart 9. The logic is a decision tree. First, the principal diagnosis places the patient in one of 25 Major Diagnostic Categories, organized by organ system. Then the presence or absence of an operating-room procedure splits medical from surgical. Then, and this is where the money moves, the patient's secondary diagnoses are examined for complications and comorbidities, and the case is assigned a severity level: no CC, a CC, or an MCC 9. Each step up that ladder assigns the patient to a higher-weighted DRG and a higher payment.
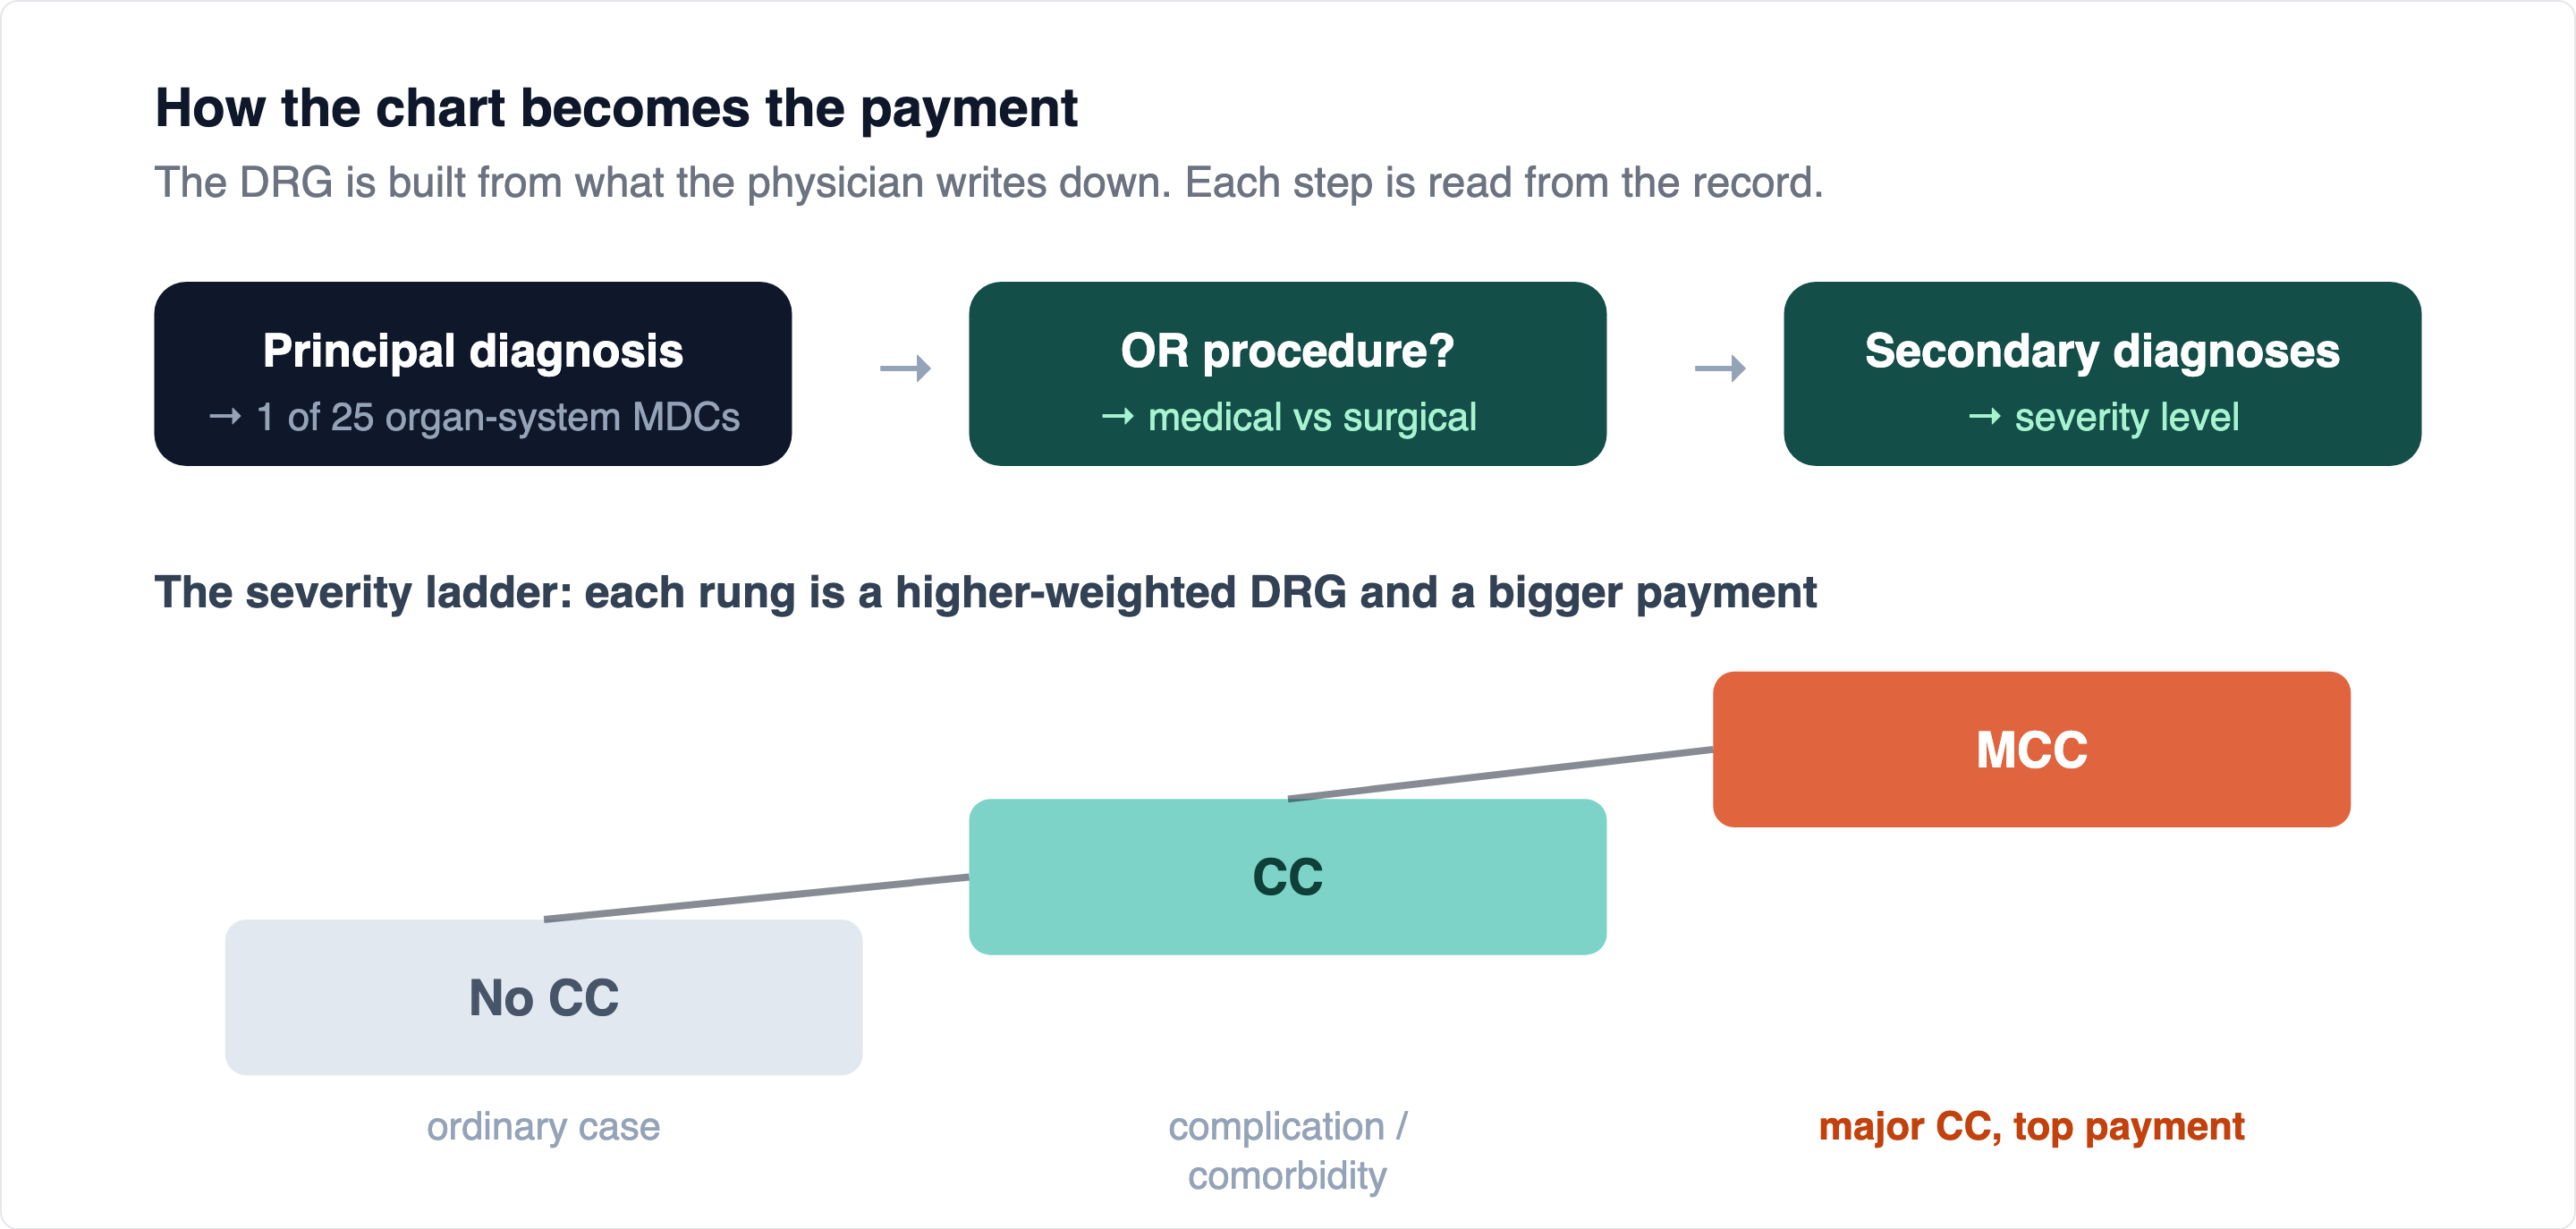
That is why the diagnosis is the money. A single secondary diagnosis, documented and coded correctly, can move a case from no-CC to CC or MCC and change the payment by thousands of dollars, for the same patient in the same bed. It is the exact mechanism behind the malnutrition documentation gap I have written about elsewhere, where documented severe malnutrition is an MCC and moderate malnutrition is a CC 11.
This is not billing trickery. It is how the system is designed to work. The payment is supposed to reflect the patient's true resource intensity, and the only way the system knows the patient's complexity is from what the physician writes down. Which is precisely why hospitals turned clinical documentation integrity into a staffed, funded revenue function, and why a word in a chart, "sepsis" versus "infection," "acute" versus "chronic," can be worth more than the day in the bed it is written on.
A single secondary diagnosis, documented correctly, can move a case up a severity level and change the payment by thousands of dollars, for the same patient in the same bed. That is why the diagnosis is the money, and the chart is a revenue document.
A payment system this powerful generates perverse incentives at its edges, and the history of the DRG is partly a history of Medicare noticing and pushing back. The first is the severity ladder losing its meaning. For its first two decades the list of diagnoses counting as a complication barely changed, and as hospitals got better at coding and healthier patients moved to outpatient care, nearly 80 percent of admitted patients ended up with a CC, which made the distinction nearly useless 9. In 2007 Medicare rebuilt the list, creating the Medicare Severity DRGs and cutting CC prevalence from about 80 percent back to 40 percent 9. The system had been gamed by drift, and it was reset.
The second is darker. Because a complication raises the DRG, the system had an appalling loophole: a complication the hospital itself caused could increase its own payment. A patient who developed a hospital-acquired infection, a pressure ulcer, an object left in after surgery, could be classified into a higher-paying group, which the source document describes plainly as "in effect financially rewarding poor quality care" 9. Congress closed it through the Deficit Reduction Act. Hospitals now report whether each diagnosis was present on admission, and a defined list of hospital-acquired conditions, if not present on admission, no longer count toward the DRG 9. The hospital can still treat the harm it caused. It can no longer be paid extra for causing it.
So if Medicare pays a fixed DRG amount that ignores every line, what is the itemized bill actually for? Several things, none of them "what Medicare will pay." It is the starting point for payers who still reimburse off charges or discounts from charges. It is the number billed to the uninsured and the out-of-network, the people who actually get charged the sticker. It feeds, through the cost-to-charge ratio, back into the cost report that helps set future DRG weights. And it is, frankly, a habit. The bill is written in a language the payment system abandoned in 1983, kept alive because it is the only language the patient reads.
Part IV. Reading the cost report as a diagnostic
Strip away the pricing debate and the cost report becomes something more useful: the highest-resolution picture of a hospital's economics that already exists, filed and certified and sitting in a public database. Read correctly, it tells you whether the hospital is dying, years before the closure announcement.
This matters because most boards govern off the wrong document. The income statement a board sees is a true document that tells a partial truth. A hospital can run a positive operating margin on the strength of things that have nothing to do with whether its core business is viable: investment income in a good market, a one-time gain on a property sale, 340B pharmacy spread, a favorable prior-year cost-report settlement landing as revenue this year. None of those keep the doors open when the market turns. A board looking at a green number can be governing a red hospital.
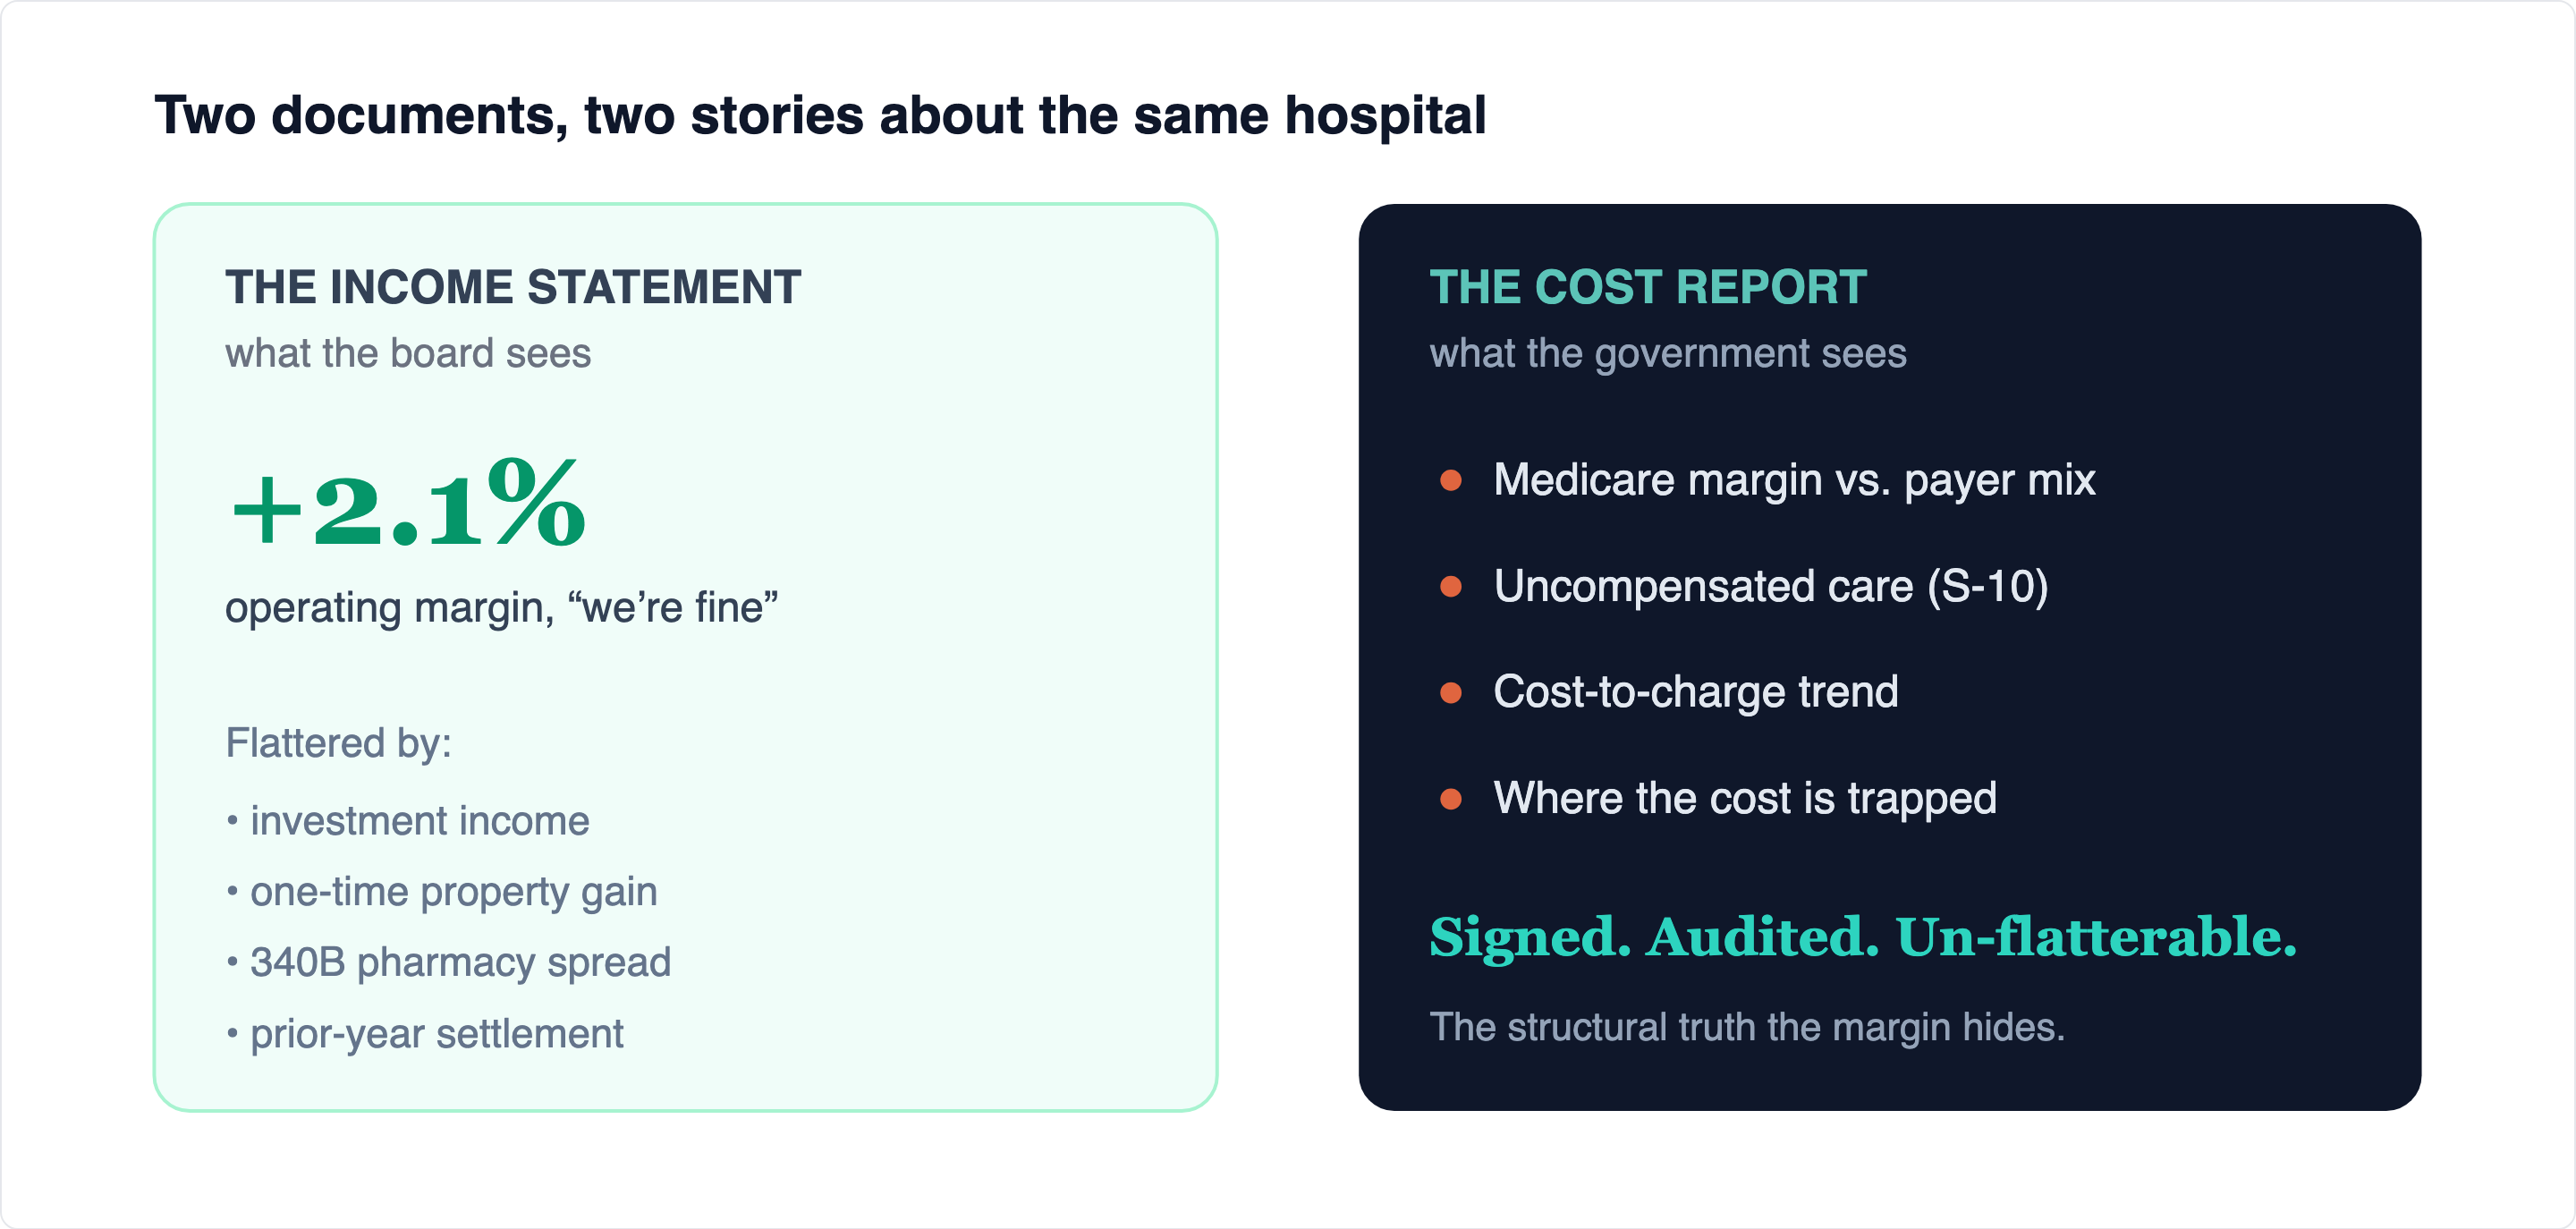
The cost report is harder to flatter, because it was designed by the government to see through exactly the smoothing a board presentation is designed to do. Four signals inside it carry the structural truth. The first is the Medicare margin against the payer mix. In aggregate, hospitals earned a Medicare margin of -12.1% in 2024 12. Medicare pays roughly 88 cents on the dollar of cost, on purpose, and it is not going up.
The aggregate is not the point. The distribution is. A hospital at the aggregate is losing money on Medicare like everyone else and surviving on the cross-subsidy from commercial patients. A hospital at -25% or -30% is in a different category. Pair that margin with the payer mix, the share of volume that is Medicare, Medicaid, and commercial, and you have the ceiling on achievable margin 4. A hospital that is 70% government-payer volume with a deep-negative Medicare margin is not having a bad year. It is structurally underwater, and no amount of throughput will fix it.
Notice that this resolves the paradox the transparency era keeps stumbling over. The hospital charging $4,500 for a day is very often the same hospital losing money on most of its patients. The enormous charge and the negative margin are not a contradiction. They are two readings off the same instrument.
A positive operating margin tells you the hospital had a good year. The Medicare margin against the payer mix tells you whether the business model works at all. Those are different questions, and only one of them predicts closure.
The second signal is uncompensated care, captured on a dedicated worksheet, S-10, covering charity care and bad debt 4. This is where a community's economic distress shows up on the hospital's books before it shows up anywhere else. Watch it as a trend, because uncompensated care climbing faster than revenue signals a deteriorating payer mix, and because S-10 drives money the hospital is entitled to through disproportionate-share and uncompensated-care payments. A stressed hospital that is also under-reporting its uncompensated care is bleeding twice: absorbing the unpaid care, then failing to claim the supplemental payment that unpaid care qualifies it for.
The third signal is the cost-to-charge ratio over time, and it is the most revealing about how a hospital is actually being run. When a hospital's ratio is steadily diluting, falling year over year, charges are being raised faster than costs, and it usually means one thing: pricing, not cost control, is doing the work of keeping the lights on 4. A revenue-cycle training deck aimed at hospital finance staff shows the maneuver in a single worked example: raise a department's charges from $1.0 million to $1.25 million on the same $200,000 of cost, and the ratio falls from 0.20 to 0.16 4.
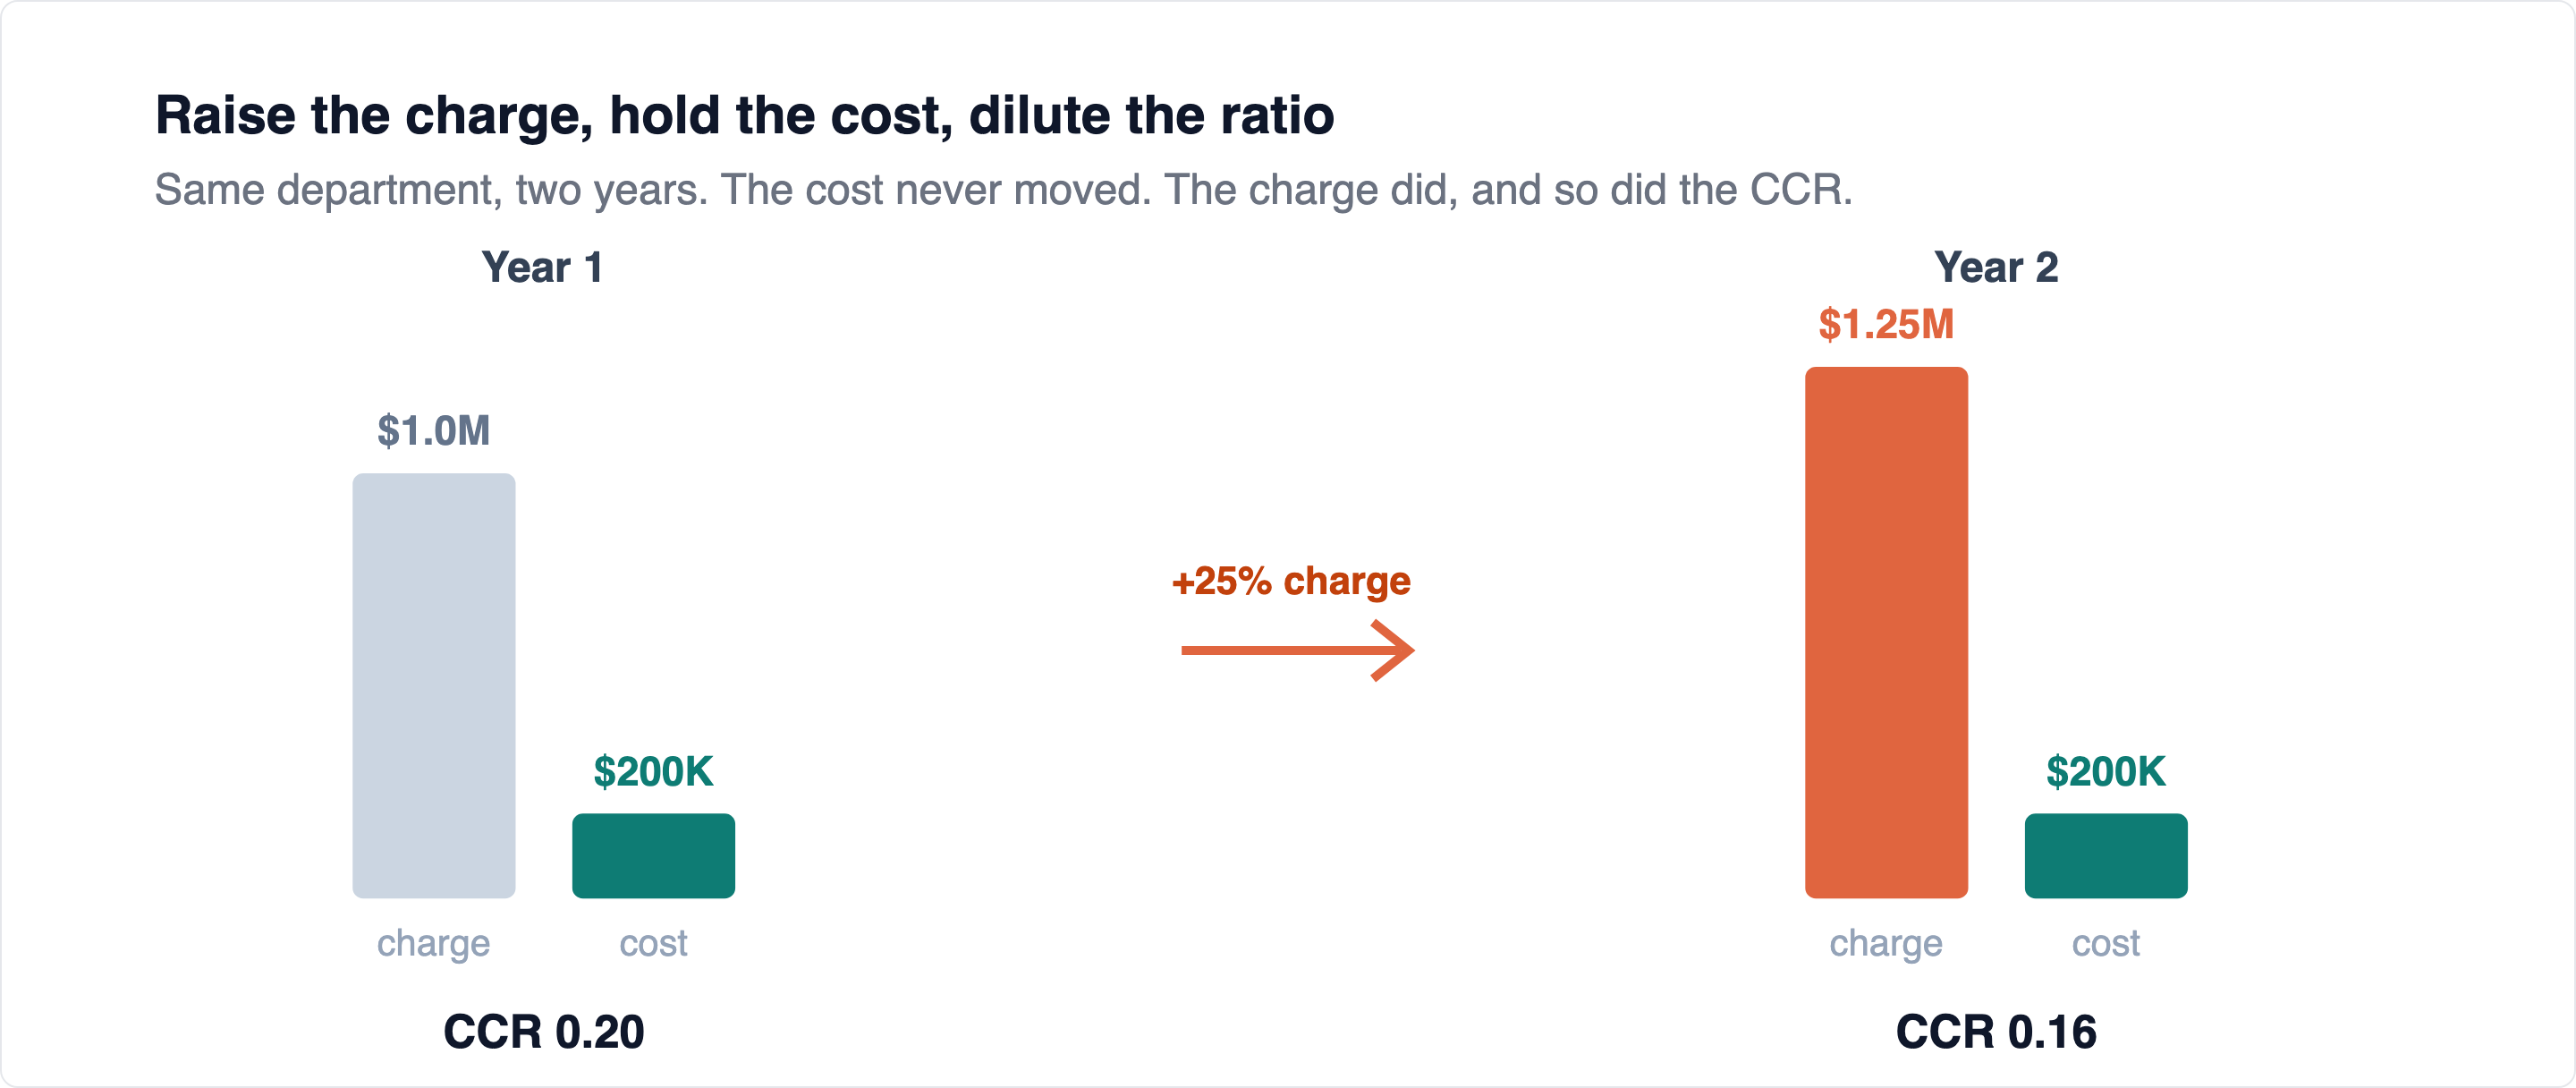
Do that across the chargemaster year over year and you get exactly the untethering the transparency data now exposes. A hospital genuinely managing its cost structure shows a relatively stable ratio. A hospital papering over a cost problem with chargemaster increases shows one sliding toward the floor. The trend is hard to fake, because both numbers are reported and audited.
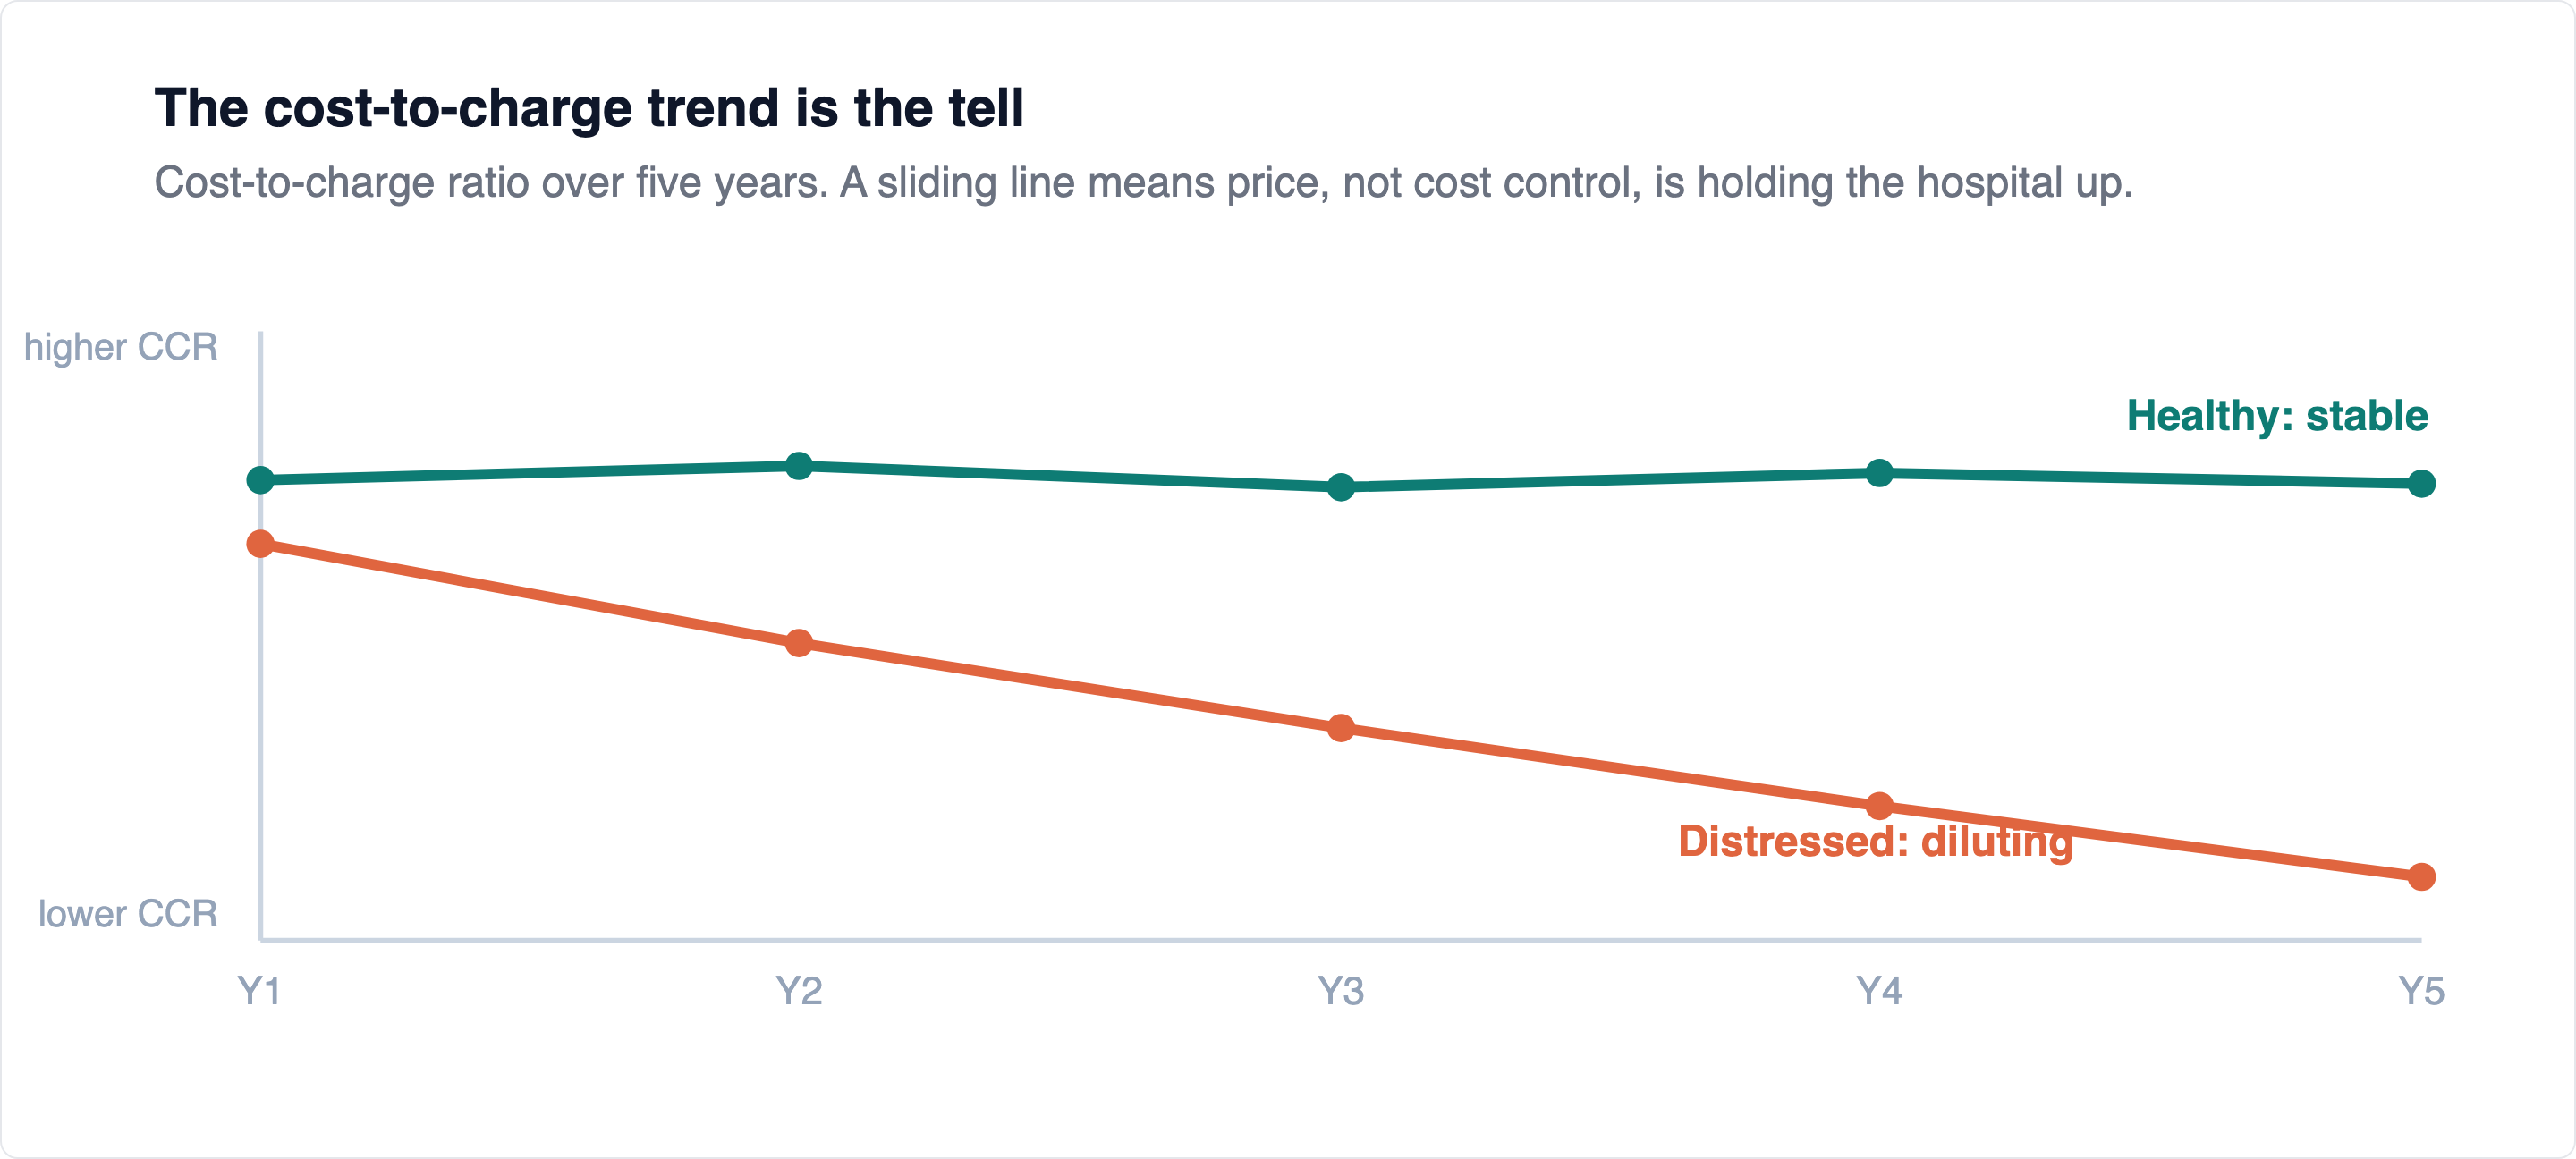
A diving cost-to-charge ratio is the fingerprint of a hospital solving a cost problem with a pricing lever. The chargemaster goes up, the real problem stays exactly where it was.
The fourth signal is where the cost is trapped. Because the report allocates cost department by department through the step-down, it shows which service lines and subunits are carrying the hospital and which are draining it 4. A skilled-nursing, rehab, or home-health subunit can be quietly generating margin or quietly bleeding, and the report says which. Whether the subunits are helping or hurting reimbursement is a question a board can only answer from this document.
The limits of the instrument matter. Cost report data are frequently incomplete, and individual fields are often reported inaccurately 3. A single cell can be wrong. A subunit can be misallocated. A one-year ratio can wobble for reasons that have nothing to do with strategy. So read it the way you read any diagnostic: trend and structure, never a single number. Three years of a diving Medicare margin, a climbing charity line, and a sliding ratio is a diagnosis. One odd cell is noise. It is an X-ray, and like any X-ray it tells you where to look, not everything you will find when you get there.
From the field · Dr. Kumar
The four questions a board should ask. None of this requires a board to become cost-report technicians. It requires four questions the income statement cannot answer, with answers drawn from the filed report rather than the reassuring deck. What is our Medicare margin, and where does it sit against our payer mix? Not the operating margin. That pair is the viability of the business model. Is our uncompensated care rising, and are we capturing what it earns? Whether the community is getting poorer on your books, and whether you are claiming the supplemental dollars that entitles you to. Is our cost-to-charge ratio stable or diluting? A sliding ratio is the signature of a hospital surviving on price increases instead of cost discipline, and the answer is auditable. Which service lines and subunits carry us, and which drain us? The question that turns a worry into a plan.
Part V. Working the cost report as a recovery instrument
Diagnosis and the beginning of treatment are on the same page, which brings us to the use that matters most to a hospital fighting to survive. In a turnaround, the money everyone chases is the money that requires someone to say yes: a better commercial contract, a new service line, more volume through the door. That money is real and it is slow. There is another kind, and it is faster, because it requires no one's permission and no new patient. It is money the hospital already earned, for care it already delivered, and simply never claimed, because the document where you claim it was filed as a compliance obligation instead of worked as a recovery instrument.
Let me be precise about the ethics before the mechanics, because it matters. This is not gaming. Every lever below is about claiming reimbursement the hospital is legally entitled to for care it actually delivered, and every one is auditable and defensible. The report is certified under penalty of federal law and reviewed by the Medicare contractor. The discipline is to capture what you earned to the level of specificity an auditor can confirm, not to invent it.
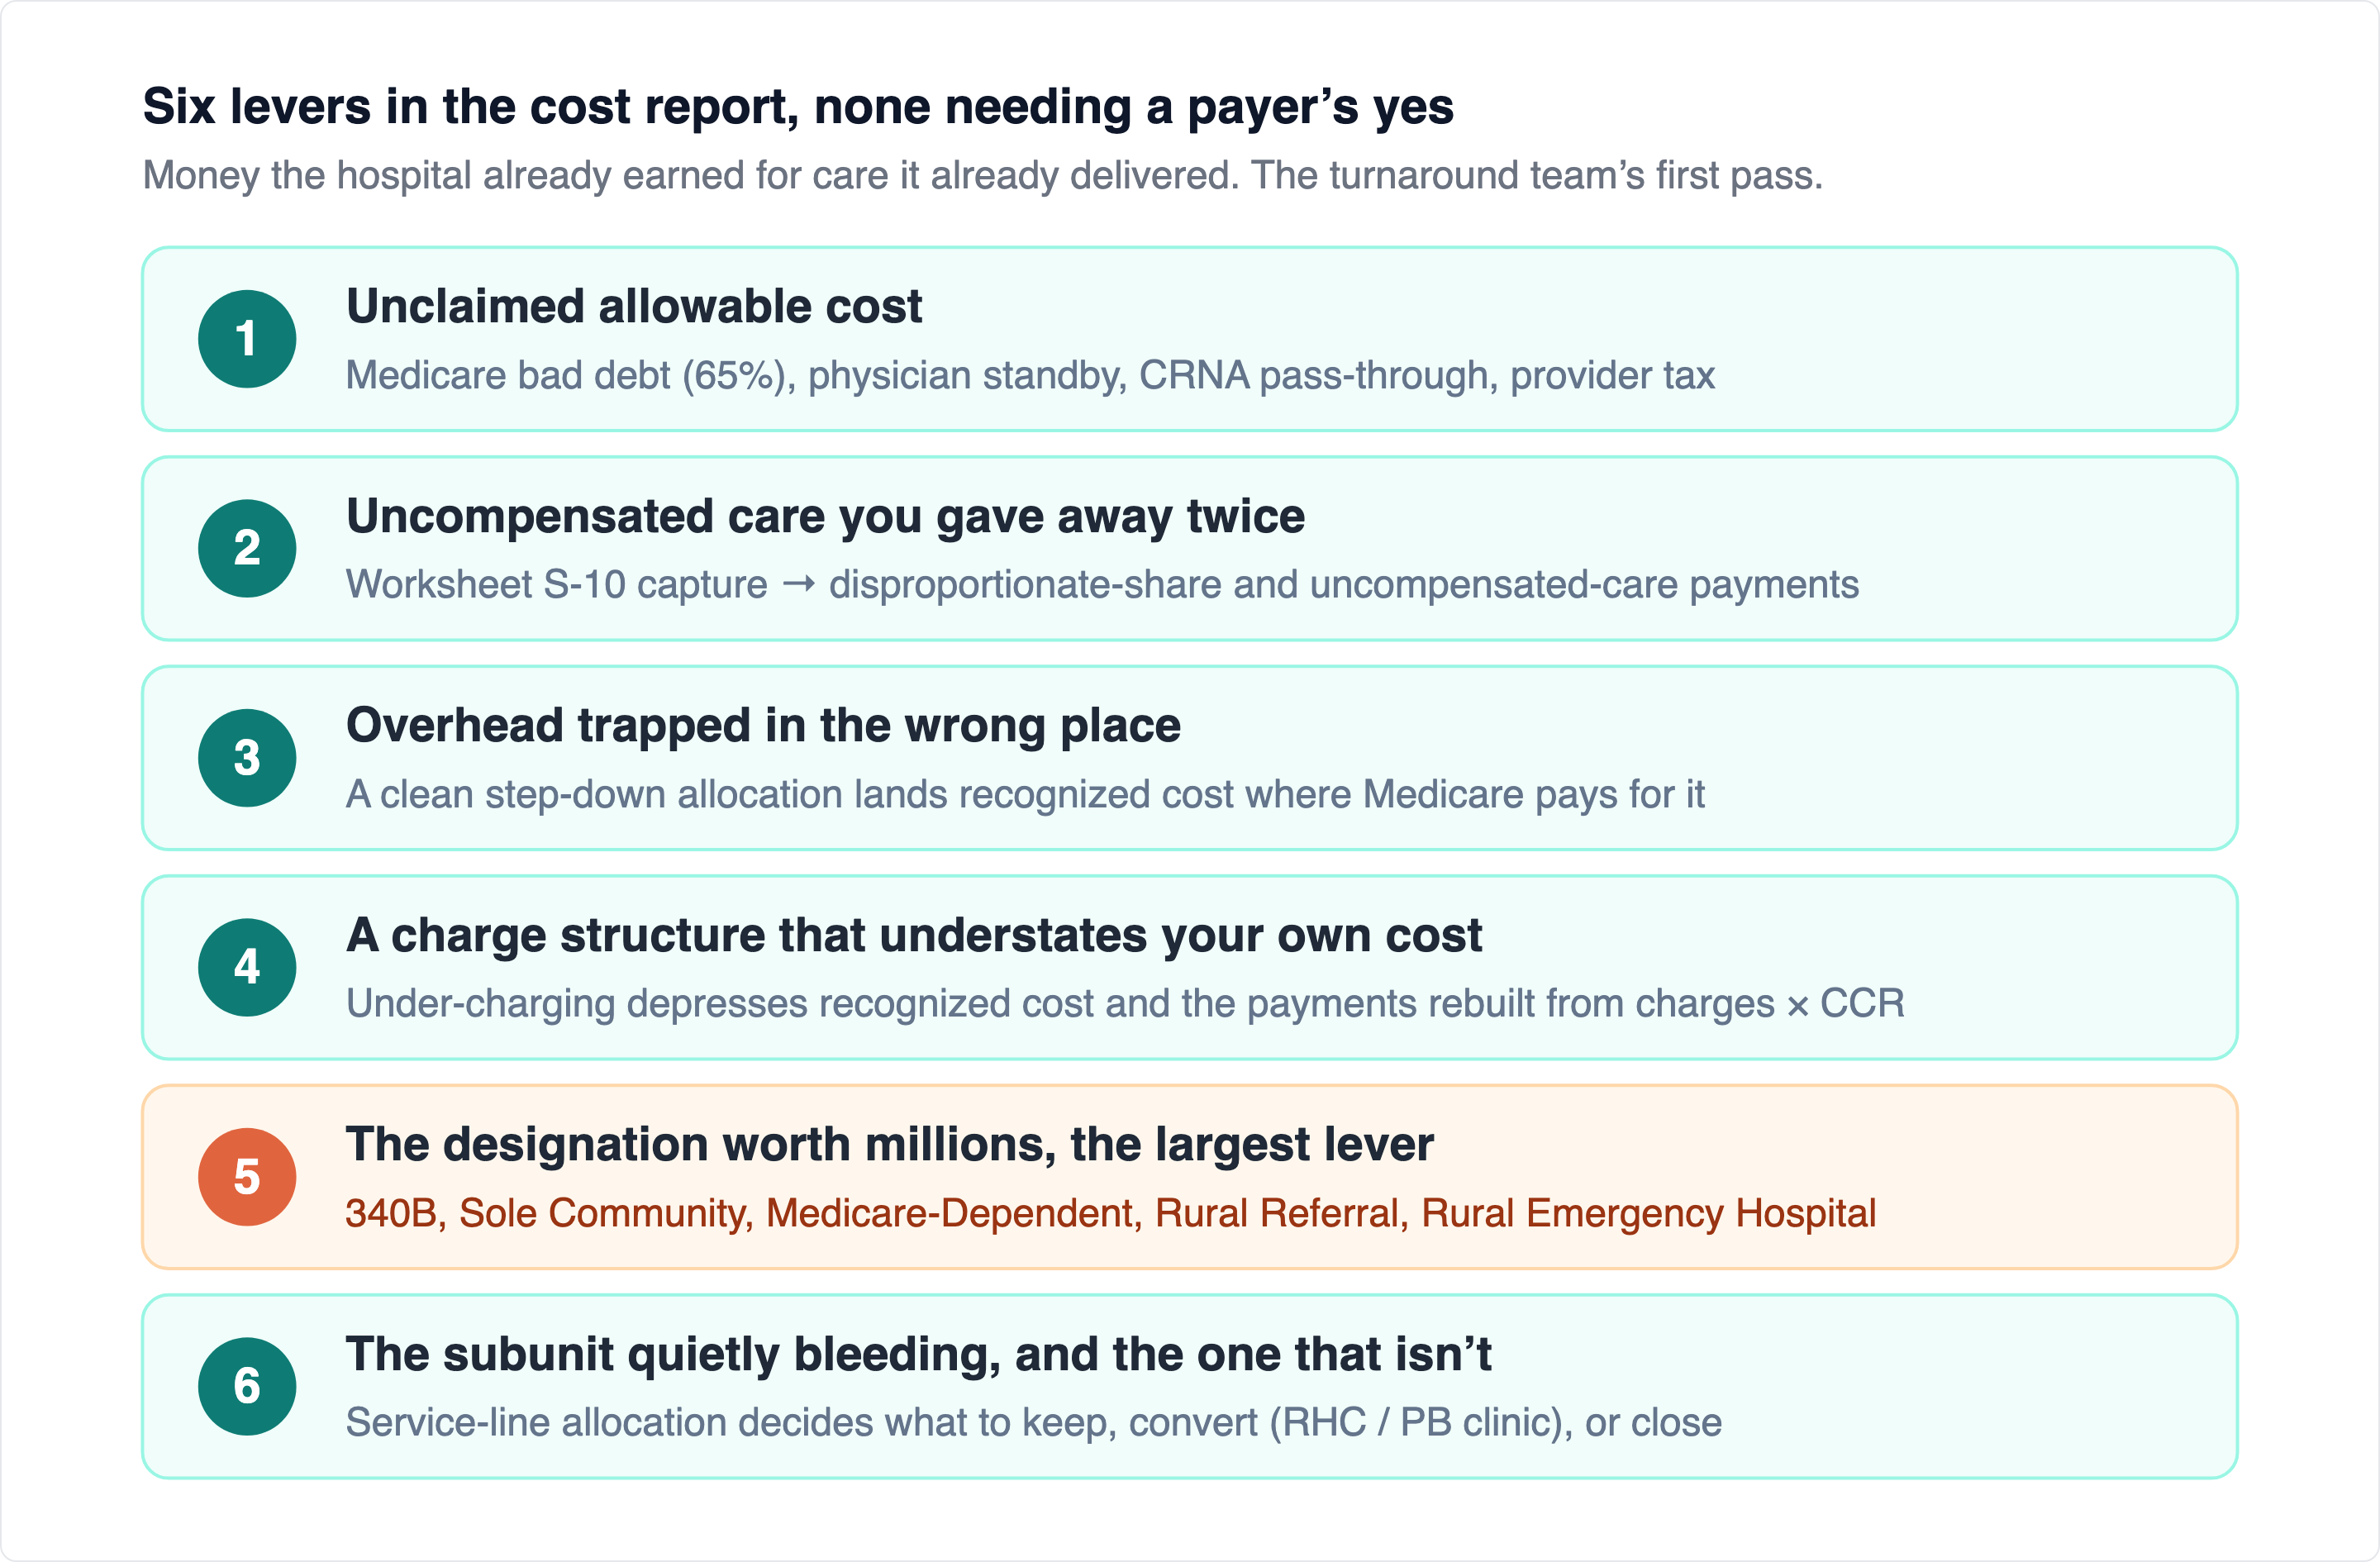
Lever one: the allowable cost you never claimed. The report only pays you for cost you actually claim, and distressed hospitals routinely under-claim because the finance team is triaging, not optimizing. Medicare bad debt is reimbursable at 65 percent and is frequently under-captured because the tracking is tedious. Physician standby time, CRNA pass-through costs, and provider taxes are allowable in defined circumstances and commonly missed. Costs sitting below the line as non-reimbursable sometimes belong above it 4. Individually these look small. Aggregated across a full report and, where the rules allow, across prior open years through amended filings, they are often the fastest cash in the building, because they attach to money already spent.
Lever two: the uncompensated care you gave away twice. Fixing S-10 capture is one of the highest-yield moves available to a safety-net or rural hospital, because it converts a loss the hospital is already taking into a payment it is already owed 4. The care was delivered. The only question is whether the report claims what the care entitles the hospital to.
A distressed hospital gives its uncompensated care away twice: once at the bedside, and again on the cost report, when it fails to claim the disproportionate-share dollars that unpaid care earns. The second loss is the one you can fix this year.
Lever three: the overhead trapped in the wrong place. In the step-down allocation, overhead departments are pushed onto the departments that use them 4. Do that carelessly and overhead lands on non-reimbursable cost centers, where Medicare will not pay for it. Do it correctly, with clean statistics and no double-counting, and more of the hospital's genuine overhead attaches to reimbursable services, where it is recognized. This is not invention, it is accuracy. The allocation is a lever precisely because it is technical enough that nobody has looked at it in years.
Lever four: the charge structure that understates your own cost. This one cuts in a direction that surprises people. A distressed hospital often has the opposite of the inflation problem in specific departments: charges set too low relative to cost, which understates the cost the report can recognize and depresses the outpatient and outlier payments rebuilt from charges times the ratio 6. If charges only cover acquisition cost, they get reduced by the applicable ratio and the resulting cost figure understates true cost, so the hospital is underpaid for care it delivered 6. The move is to bring the charge structure into a defensible relationship with actual cost, high enough that cost is fully recognized, disciplined enough to stay inside the guardrails, since a ratio outside a normal band of roughly 0.10 to 5.00 is flagged for review 5.
Lever five: the designation worth millions, decided on one filing. The largest single lever, and it is decided almost entirely on cost-report data. 340B covered-entity eligibility turns on a disproportionate-share percentage read off the settlement worksheet, above 11.75% for DSH hospitals and at least 8% for sole community and rural referral hospitals 2. Alongside it sit Sole Community Hospital, Medicare-Dependent Hospital, Rural Referral Center, and the newer Rural Emergency Hospital designation created specifically as a lifeline for facilities that cannot sustain inpatient care 2,4. Each materially changes the payment structure, and eligibility for each is a function of numbers the hospital is already reporting. The designation questions belong on the first page of any turnaround diagnostic.
Lever six: the subunit that is quietly bleeding, and the one that isn't. Because the report allocates cost and reimbursement by service line and subunit, it answers the questions the income statement blends away. Does converting this clinic to a rural health clinic, paid on cost-per-visit with its own productivity standards, improve its economics? Is this subunit worth keeping, restructuring, or closing? Does consolidating these cost centers help or hurt? 4 This is where diagnosis becomes decision, on real numbers.
If this money is real and recoverable, why is it so routinely forfeited? Three reasons. The report is filed to comply, not to recover. The goal of the team completing it is a clean, on-time, audit-passing filing, and "correct enough to pass" is a very different standard from "optimized to capture." The expertise is specialized and the distressed hospital is short of it. Working a cost report for recovery sits at the intersection of accounting, Medicare regulation, and clinical operations, and the hospitals that most need that expertise are least able to staff it. And it is invisible on the instrument everyone watches. The board watches the operating margin. Unclaimed allowable cost, uncaptured uncompensated care, a missed designation, none show up as a line that says "money you forgot to collect." They show up only as a smaller settlement and a thinner year, indistinguishable from bad luck.
None of this replaces the strategic turnaround, the payer renegotiation, the cash discipline, the honest go-or-no-go decision about whether the next dollar still moves the needle. Those are harder, slower, and more consequential. But they take time a distressed hospital may not have, and while that work is underway, the cost report is the lever that buys runway now, from money the hospital already earned.
Part VI. What happens when a boring form controls real money
Everything to this point is the view from inside one hospital. Step back to the level of the whole system and the same document looks different. There is a rule of thumb in Washington and in health care both: whatever the money keys off of is what gets fought over. Not the care, not the mission, not the rhetoric. The definition, the threshold, the number on the form. Because tens of billions of dollars a year in Medicare rates, disproportionate-share payments, and 340B discounts are calculated from what hospitals report here, the cost report has become something no accounting schedule was ever meant to be: a battlefield.
Medicare adjusts every hospital's payments for local labor costs through the wage index, built from wage data hospitals report on the cost report. A hospital in a high-wage market is paid more for the same care than one in a low-wage market. The intent is fair. The execution has become a game. Because the index is relative and partly built on floors and averages, a hospital can raise its own payments by changing its classification. More than 425 urban hospitals reclassified themselves as rural between 2017 and 2023, which can raise a state's rural floor and lift the index for other hospitals, and many reverted to their original designation once the benefit was captured 13.
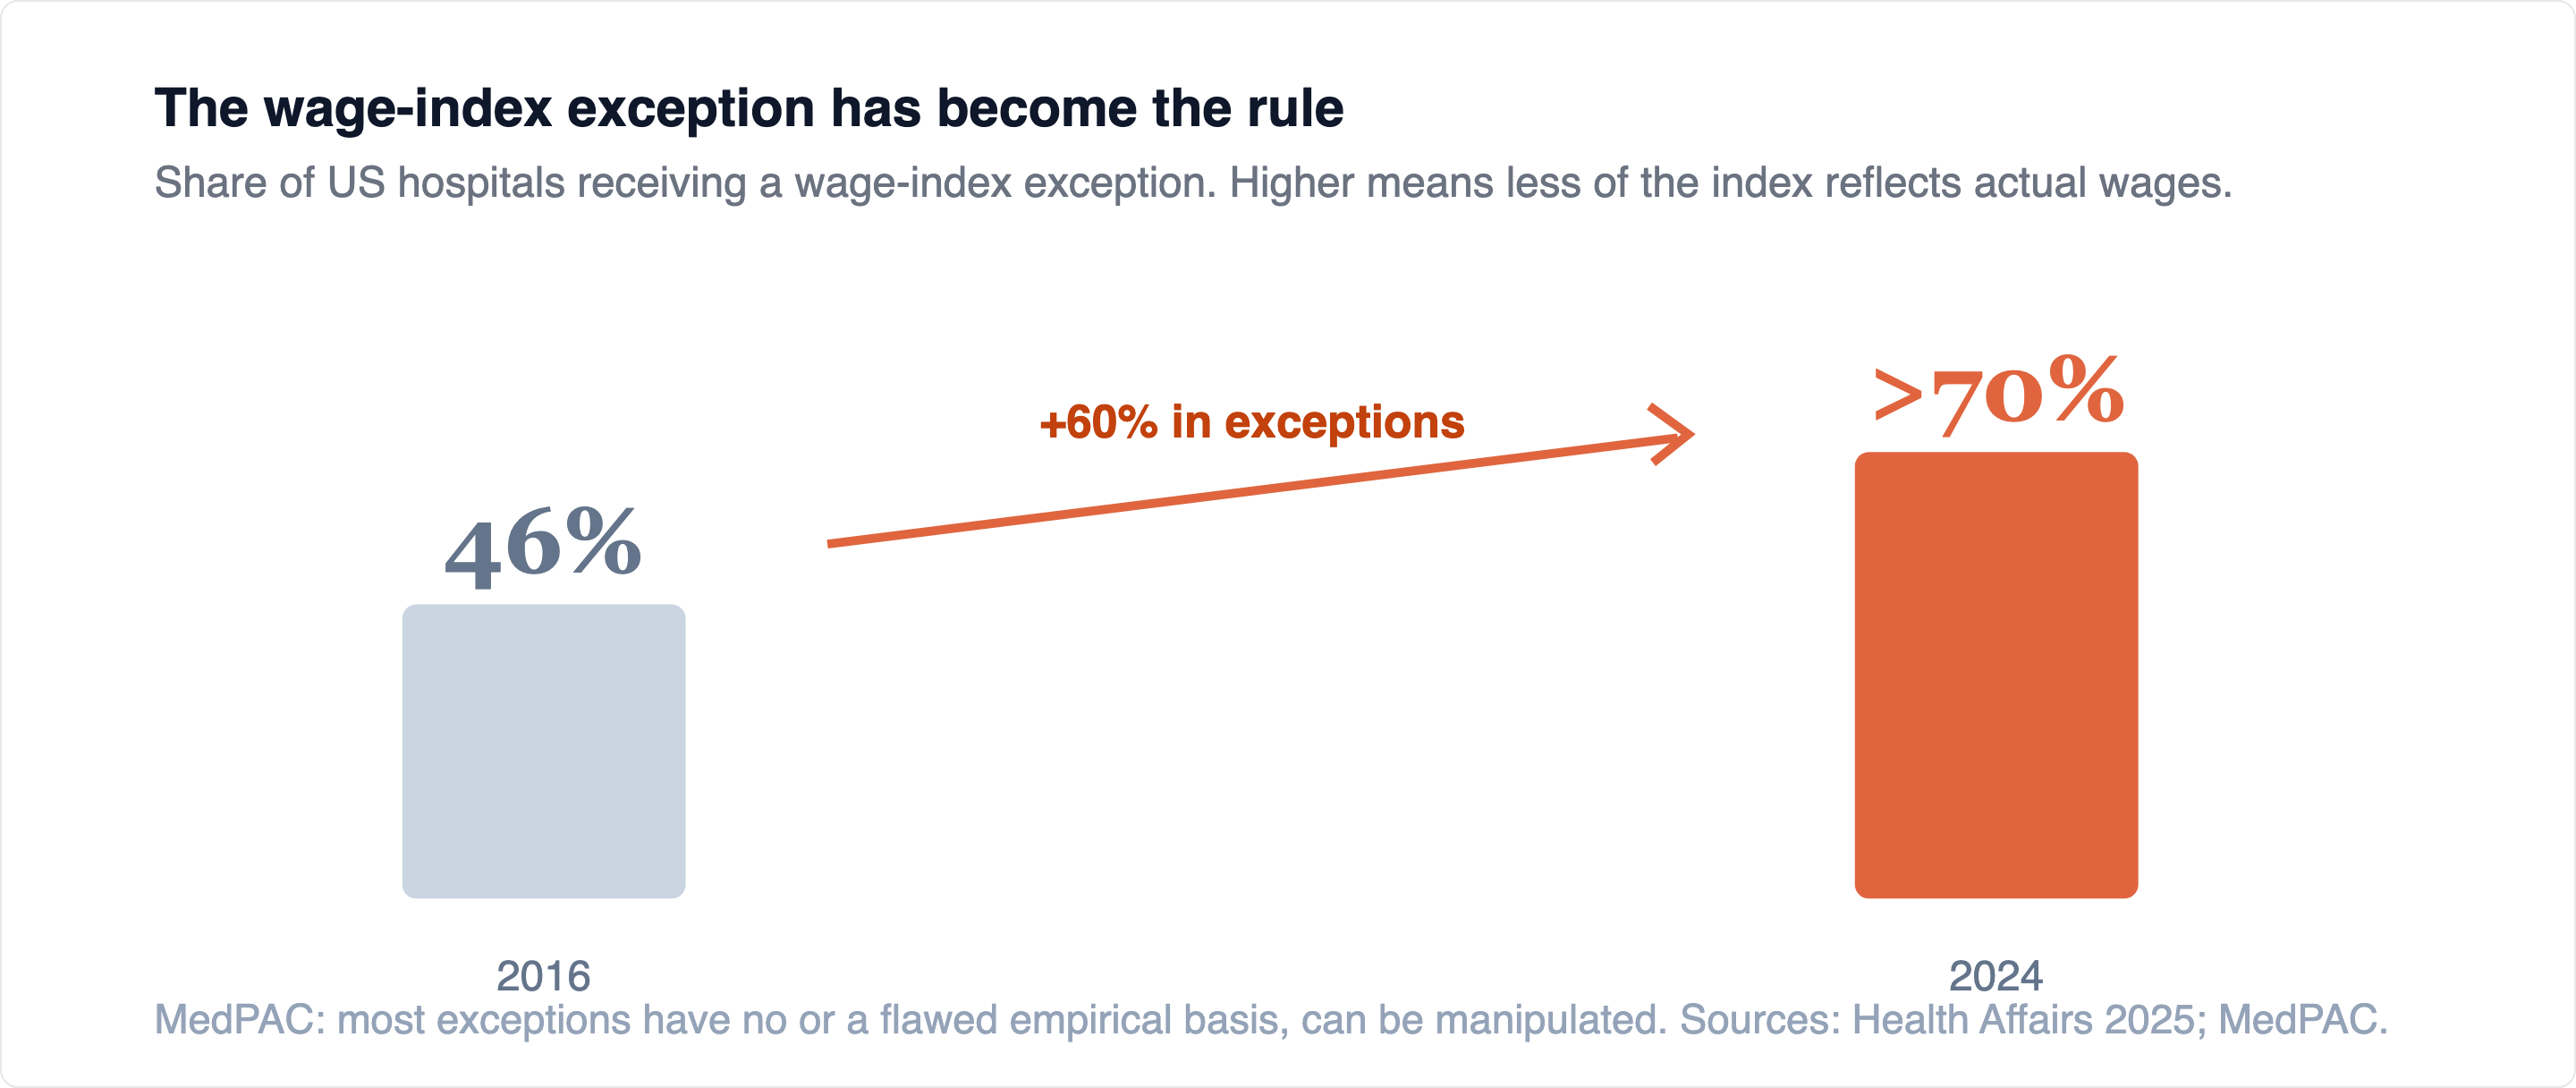
The exceptions have metastasized: wage-index exceptions grew by nearly 60 percent from 2016 to 2024, and by 2024 more than 70 percent of hospitals were receiving one, up from 46 percent in 2016 13. The payoff is concrete. Geographic reclassification is worth roughly $650,000 in additional annual revenue on average, a rural-floor adjustment roughly $930,000 13. MedPAC, which has studied this for years, does not mince words: most of these exceptions have no empirical basis or a flawed one, can be manipulated, and reduce the accuracy of the very wage adjustment they are supposed to make 14. Nobody is committing fraud. Everybody is optimizing. And the sum of all that optimizing is a wage index that measures gamesmanship as much as it measures wages.
The loudest fight is 340B, and its entry ticket is a single number on the cost report. The program lets qualifying hospitals buy outpatient drugs at steep discounts, and eligibility for most hospitals turns on the disproportionate-share percentage calculated from this filing 2,4. That one number gates one of the largest and most contested flows of money in American health care.
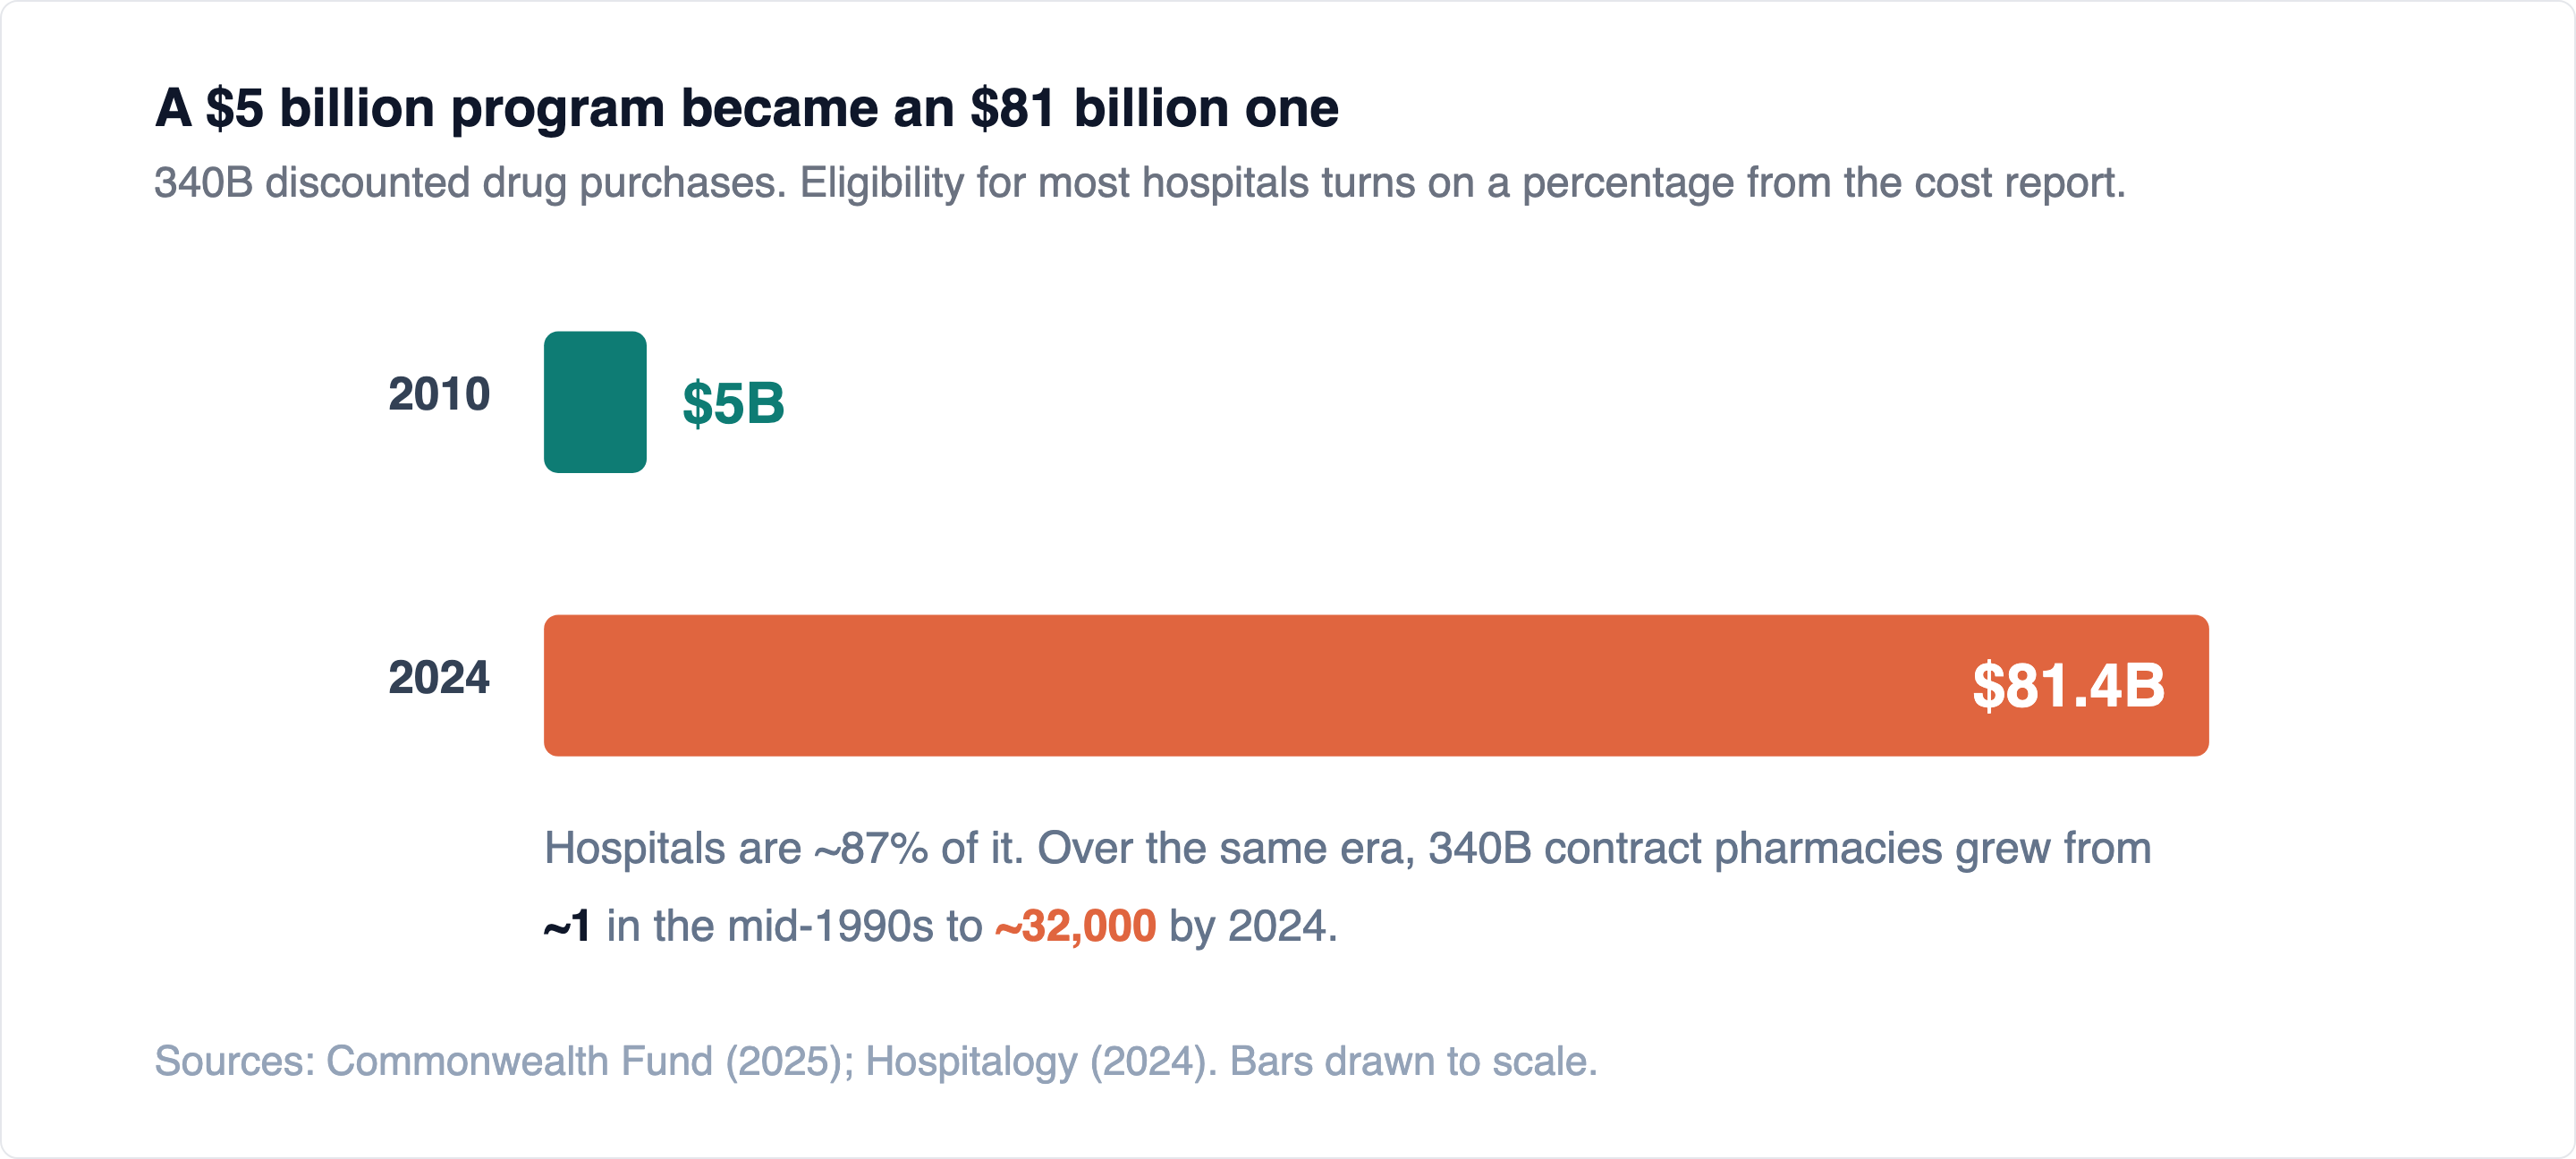
The scale is staggering and the growth is the story. The program went from about $5 billion in discounted drug purchases in 2010 to $81.4 billion in 2024, with hospitals accounting for roughly 87 percent of it 15. Contract pharmacies dispensing 340B drugs grew from essentially one in the mid-1990s to around 32,000 by 2024 15. The controversy sits in the spread: a hospital buys the drug at the discount, administers it to an insured patient, bills the insurer at the normal rate, and keeps the difference, with no requirement that the difference be spent on the needy patients the discount was meant to help 15. In 2024 manufacturers moved to force hospitals to pay full price and claim rebates only after verifying eligibility, arguing hospitals were gaming the program, while the industry's lobby alleged $1.6 billion in duplicate discounts in a single year 15,16.
I want to be fair to the hospitals here, because the honest picture is genuinely mixed. For a safety-net or rural hospital losing money on Medicare, 340B is not a loophole, it is oxygen, and it flows to exactly the disproportionate-share hospitals the cost report identifies as serving the poor. The fact that a for-profit drug industry is the one crying foul should temper the outrage. But growth from $5 billion to $81 billion is not explained by a growing poor population, and the program's own defenders struggle to show the spread reaches patients. Both things are true. And an $81 billion fight turns on a percentage calculated from the cost report.
340B went from $5 billion to $81 billion in fourteen years. For a rural hospital it is oxygen; for a drugmaker it is a scam; for both it turns on one number on the cost report. That is what it means for a form to control real money.
The third arena is where the incentive to inflate is most obvious and where the government has finally pushed back. Because disproportionate-share dollars are distributed based on each hospital's share of total reported uncompensated care, every hospital has a reason to report generously, and because the pool is finite, one hospital's generous reporting dilutes everyone else's payment. It is a race, and the track is the S-10 worksheet. When CMS began auditing S-10 in earnest, roughly 10 percent of audited hospitals showed more than a $20 million difference between their audited and previously unaudited uncompensated-care figures 17. That is not rounding. That is the gap between what hospitals reported when nobody was checking and what survived when someone did. CMS has since made S-10 a primary audit target 17.
The easy cynical version says hospitals are gaming the system, full stop. The easy defensive version says hospitals are just recovering what they are owed, full stop. Neither survives contact with the actual document. The truth is that the cost report sits on a continuum, and every hospital operates somewhere on it. At one end is legitimate optimization, claiming reimbursement you genuinely earned, which for a distressed hospital is not just permissible but a survival obligation. At the other end is gaming, stretching a definition to capture money the rules did not intend for you. In between is a wide gray band, and most of the fights above live in it. They are not fraud. They are optimization pushed to the edge of what the definitions allow, by institutions losing 12 percent on the average Medicare patient and reaching for every legal dollar.
That context cuts both ways. It makes the gaming more understandable, because these are stressed actors rather than greedy ones. And it makes the gaming more corrosive, because every dollar captured through a stretched definition is pulled from finite pools that other, often needier, hospitals depend on. When the cost report is gamed, the loser is usually another hospital. That is the part the defensive version leaves out.
The cost report is a continuum. At one end, claiming what you earned. At the other, gaming a definition. Most of the billion-dollar fights live in the gray band between, and when the form is gamed, the loser is usually another hospital.
One last observation, because it explains why these fights are so invisible. Health-care policy is usually argued in the open, over coverage and access and prices, the things patients feel. These fights are argued in the definitions of a filing almost no citizen has seen. When money keys off a number, the fight moves to wherever the number is defined. So the real action sits in places with no public constituency: whether a hospital counts as rural, how a disproportionate-share percentage is calculated, what documentation a charity-care entry requires. Those questions move more money than the ones that make the news, which is why the lobbying around them is ferocious and why the reforms MedPAC has recommended for years keep stalling. The boring form is where the power is, precisely because it is boring enough that almost no one is watching.
From where I sit
I have spent my career watching patients and families try to make sense of what American health care costs them, usually at the worst possible moment, holding a bill they cannot parse for care they did not choose. The bill is designed to look authoritative. It is the least authoritative number in the entire transaction.
The document that actually governs whether their hospital survives, whether it can keep the service line open, whether it qualifies for the supplemental payments that keep rural and safety-net hospitals alive, is the one they will never see, written in a language of worksheets and cost centers and ratios. The public gets the fiction and the outrage. The real ledger is filed quietly, under signature, and read by almost no one outside the finance office. That asymmetry is worth naming, and it is not only a problem for patients. It is a problem for the boards governing these institutions, who are reading the flattering document instead of the honest one, and for the operators who file this report to comply when they could be working it to survive.
The bottom line
The $4,500 hospital day is not a cost and not a payment. It is a charge, the loudest and least meaningful of the three numbers that describe a day of care, inflated on purpose, paid mostly by the people least able to fight it, and carried on the books precisely because the entire rate-setting machine is built on top of it. For Medicare inpatients it is more decorative still, because the day stopped being the unit of payment in 1983 and the unit became the patient, sorted into a group by an idea that started at Yale as a way to measure quality.
The number that matters is the cost, and it is not hidden. It is filed once a year, department by department, reconciled to the audited books, and signed under penalty of federal law. It decodes the sticker. It sets everyone's future rates. It reveals, years in advance, whether a hospital is structurally dying. For a hospital fighting to survive it is a map of money already earned and never claimed. And because it decides so much, it has become the place where the real fights happen, on a form almost nobody reads, in definitions almost nobody watches, moving more money than the debates that make the headlines.
None of that makes hospitals villains. Most are stressed institutions reaching for legal dollars in a system that underpays them. But it should retire, permanently, the idea that the Medicare cost report is a neutral clerical exercise. The hospitals that survive the next decade will be the ones that stop treating it as a compliance chore and start reading it as what it is: their own ledger, rather than their own marketing. If you want to understand who wins and loses in hospital finance, do not follow the press releases. Follow the worksheet.
Is your cost report a compliance chore or a recovery instrument?
Most distressed hospitals file this document correctly and work it at a fraction of its value. A3HCS reads the cost report the way a turnaround team reads it: unclaimed allowable cost, uncaptured uncompensated care, overhead stranded in the wrong cost centers, and the designations worth millions that are decided on data you are already reporting. Every dollar of it is reimbursement you already earned for care you already delivered, and none of it requires a payer to say yes.
References
- Coomer NM, Ingber MJ, Coots L, Morley M. Using Medicare Cost Reports to Calculate Costs for Post-Acute Care Claims. RTI Press Publication No. OP-0036-1701. Research Triangle Park, NC: RTI Press; January 2017. DOI: 10.3768/rtipress.2017.op.0036.1701.
- Apexus / 340B Prime Vendor Program. Understanding the Medicare Cost Report (Form CMS-2552-10). 2025. Filing timeline; CFO certification per 42 USC 1395g; cost-center structure; 340B covered-entity eligibility and disproportionate-share thresholds (>11.75% DSH; >=8% SCH/RRC) read off Worksheet E Part A, line 33.
- Coomer NM, Ingber MJ, Coots L, Morley M. RTI Press, 2017 (as above). Calculated cost versus payment; cost-center-specific cost-to-charge ratios as the accepted method for recovering true cost; HCRIS as the public dataset; cost report data frequently incomplete or inaccurately reported.
- Brill CA. Medicare Cost Report Basics and Special Designations. Blue & Co., LLC. Worksheet A reconciliation to audited financials; Worksheet B step-down allocation; Worksheet C cost-to-charge ratios and the charge-inflation worked example; Worksheet E settlement; Worksheet S-10 uncompensated care; payer mix; Medicare bad debt at 65%; physician standby, CRNA pass-through and provider tax as allowable cost; subunit and service-line reimbursement; rural health clinic and provider-based considerations; special designations (340B, SCH, MDH, RRC, Rural Emergency Hospital); critical access hospitals at ~101% of cost.
- Illinois Department of Healthcare and Family Services. Instructions for Preparation of Hospital Statement of Cost. Rev. 2025-2026. Prospective-payment cross-provider rate effect; lower of cost or charges; 150-day filing requirement and payment suspension; cost-to-charge ratio review band 0.10-5.00.
- Association for the Advancement of Blood & Biotherapies (AABB). Understanding Cost-to-charge Ratios and Their Role in Medicare Ratesetting. 2023. Ratio definition and markup translation; national average departmental ratios FY2024 (0.033 CT to 0.417 routine days; 0.245 blood) per CMS FY2024 IPPS Final Rule, Fed Regist 2023;88(65):58792; the $1,000 x 0.245 = $245 worked example; IPPS/OPPS rates built from charges x ratio; under-charging understates recognized cost and future payment.
- Bai G, Anderson GF. Extreme Markup: The Fifty US Hospitals With The Highest Charge-To-Cost Ratios. Health Affairs. 2015;34(6):922-928. DOI: 10.1377/hlthaff.2014.1414.
- KFF State Health Facts. Hospital Adjusted Expenses per Inpatient Day, 2023 (from the American Hospital Association 2023 Annual Survey). National ~$3,132; nonprofit $3,288; for-profit $2,529; state/local $2,857.
- 3M Health Information Systems (under contract with the Centers for Medicare & Medicaid Services). Design and Development of the Diagnosis Related Group (DRG). PBL-038, October 2019. Yale origins (late 1960s) as a quality and utilization tool; case-mix complexity previously lacking an operational definition; New Jersey first payment application (late 1970s); TEFRA 1982 case-mix adjustment; 1983 Social Security Act amendment creating the national DRG-based prospective payment system; MS-DRG v37.0 with 761 groups built from 72,184 diagnoses; resource intensity versus clinical severity with the terminal-cancer example; 25 Major Diagnostic Categories; medical and surgical split; CC and MCC severity ladder; the 2007 MS-DRG redefinition cutting CC prevalence from ~80% to ~40%; hospital-acquired conditions and the present-on-admission indicator under the Deficit Reduction Act of 2005.
- Centers for Medicare & Medicaid Services. Acute Care Hospital Inpatient Prospective Payment System (IPPS). Fixed prospective payment per discharge based on the assigned MS-DRG; DRG relative weights and the case-mix index. Accessed July 2026.
- NewsHX (Kumar N). As Many as Half of Hospital Patients Are Malnourished. Fewer Than One in Ten Leaves With the Diagnosis. 2026. Documented severe malnutrition (ICD-10 E43) as an MCC and moderate (E44.0) as a CC, and the DRG-uplift mechanism when captured.
- Medicare Payment Advisory Commission (MedPAC). Report to the Congress: Medicare Payment Policy, Chapter 3, Hospital Inpatient and Outpatient Services. March 2025. Aggregate hospital Medicare fee-for-service margin -12.1% (2024).
- Medicare's Hospital Wage Index Exceptions Grew By Nearly 60% From 2016 To 2024. Health Affairs. 2025. Exceptions grew ~60% (46% of hospitals in 2016 to >70% in 2024); >425 urban hospitals reclassified as rural 2017-2023; average reclassification ~$650,000 and rural-floor adjustment ~$930,000 in additional annual revenue. See also Congressional Research Service, Medicare Hospital Payments: Adjusting for Variation in Geographic Area Wages, R46702.
- Medicare Payment Advisory Commission (MedPAC). Reforming Medicare's Wage Index Systems (Binkowski & Stensland). September 2022. Most wage-index exceptions have no or a flawed empirical basis, can be manipulated, and reduce the accuracy of the wage adjustment.
- Commonwealth Fund. 340B Drug Pricing Program: How It Works and Why It's Controversial. August 2025; and Hospitalogy, 340B Breakdown. December 2024. Program growth from ~$5B (2010) to $81.4B (2024), hospitals ~87%; contract pharmacies from ~1 (mid-1990s) to ~32,000 (2024); acquisition-to-reimbursement spread; PhRMA duplicate-discount allegation (~$1.6B).
- Healthcare Dive. Hospitals Irate After Eli Lilly Follows Through on 340B Ultimatum. 2024. Manufacturers moving to a rebate-after-verification model, arguing hospitals were gaming the program.
- Centers for Medicare & Medicaid Services, Worksheet S-10 Audit FAQs; California Hospital Association, Medicare Uncompensated Care Worksheet S-10 Reporting & Audits. ~10% of audited hospitals showed a >$20M difference between audited and unaudited uncompensated-care data; S-10 and disproportionate-share now a primary Medicare contractor audit target.