


On March 31, 2026, a black box opened. Under the CMS Interoperability and Prior Authorization Final Rule, every Medicare Advantage organization, Medicaid managed care plan, and federally facilitated Marketplace issuer had to post its prior authorization metrics for calendar year 2025 on a public website.1 On August 13, KFF published the first serious analysis of what came out: 14 insurers, roughly 71 million enrollees.2
The findings traveled fast. Medicare Advantage plans denied 12% of standard prior authorization requests. Medicaid managed care denied 14%. ACA Marketplace plans denied 18%. And the number that anchored nearly every headline: when denials were appealed, 67% were overturned in Medicare Advantage, 47% in Medicaid managed care, 43% in the Marketplace.2
That last statistic got read as an indictment, and in one sense it is. If you reverse two-thirds of your own decisions the moment somebody pushes back, your initial decisions deserve scrutiny.
But read it again as a measurement. An overturn rate is a percentage of appeals, not a percentage of denials. It tells you what happened to the people who fought. It is silent on everyone else, and everyone else is most of them.
A 67% overturn rate does not mean two-thirds of denials were wrong. It means two-thirds of the denials that were contested by someone with the time, health, and support to contest them were reversed. The rest of the denominator is missing.
The rule reports rates, and only rates
This is not a subtle gap. It is written into the regulation. CMS-0057-F requires impacted payers to post the percent of requests approved, the percent denied, the percent approved after appeal, and the average time from submission to decision.1 KFF's analysis catalogues what that leaves out, and the list is longer than the list of what is included.2
What CMS-0057-F does not require. The number of requests behind any metric, so percentages only and no counts anywhere. The number of appeals, so there is no appeal rate in the data. A breakdown by service category, which KFF says plainly does "not allow for further analysis into which services are being denied." The reason for a decision. A standardized format, since use of the CMS template is voluntary. And the distribution of response times, reported as averages with no ranges and no count of decisions that blew past the required timeframe.1,2
There is also no automatic external medical review of upheld denials in Medicaid managed care or the Marketplace.2 If the plan says no twice, that is the end of it. And KFF adds the detail that matters most for anyone hoping this improves on its own: the proposed 2026 rule does not add a service-category reporting requirement.2 The gap is not scheduled to close.
So the first year of prior authorization transparency produced a set of contract-level percentages with no numerators, no denominators, no service types, and no reasons. It is genuinely more than we had. It is also, on its own, close to unusable for the question clinicians actually ask, which is what is being denied, to whom, and what happened next?
Even the little that is required was not reliably posted
Six weeks after the OIG briefs, the American Medical Association went and checked whether plans were actually complying with the disclosure requirement. It reviewed how 15 Medicare Advantage contracts had implemented the transparency provisions of CMS-0057-F and found a consistent pattern: surface compliance, functional inaccessibility.10
Plans posted hundreds of pages of billing codes with no plain-language descriptions. They buried required disclosures behind physician or member portals and deep inside plan websites. They reported, in the AMA's words, "mathematically impossible statistics and turnaround times without units."10 And they left things out. The AMA found plans omitting entire categories of care from public reporting, naming "behavioral health and post-acute services" specifically.10
On August 17, 2026, the AMA announced that CMS had revised its Prior Authorization Metrics Reporting Overview Template in response.1011 The updated guidance states that a disclosure sitting behind a password, or one that cannot be easily reached from the payer's website, is not publicly accessible. It requires plans to identify every medical item and service subject to prior authorization. It requires plain-language descriptions alongside procedure codes. And it requires units on every metric, with median turnaround times under one day reported in hours rather than as "0 days."
That is a real fix and it is worth saying so. It is also a fix to the delivery of the data, not to the content of it. Nothing in the revised template requires a count, an appeal volume, or a service category. The first-year numbers the whole sector spent August analyzing came out of postings that a physicians' association had to go find by hand.
It raises a question nobody has answered yet. If post-acute services were among the categories plans omitted, then the 12% Medicare Advantage denial rate is a percentage of whatever each plan chose to disclose, and whether post-acute sits fully inside that denominator is not knowable from the published data. No one has re-run the analysis against corrected postings. That is a question, not a finding, and it should not be reported as one until someone does the work.
Where the data does exist, the picture is much worse
To see what the transparency rule cannot show you, you have to go somewhere the government collected the underlying records by hand. On June 8, 2026, the HHS Office of Inspector General issued two data briefs built from request-level prior authorization data pulled directly from 19 Medicare Advantage organizations covering June 2024, a single month, across 29.3 million enrollees.3,4
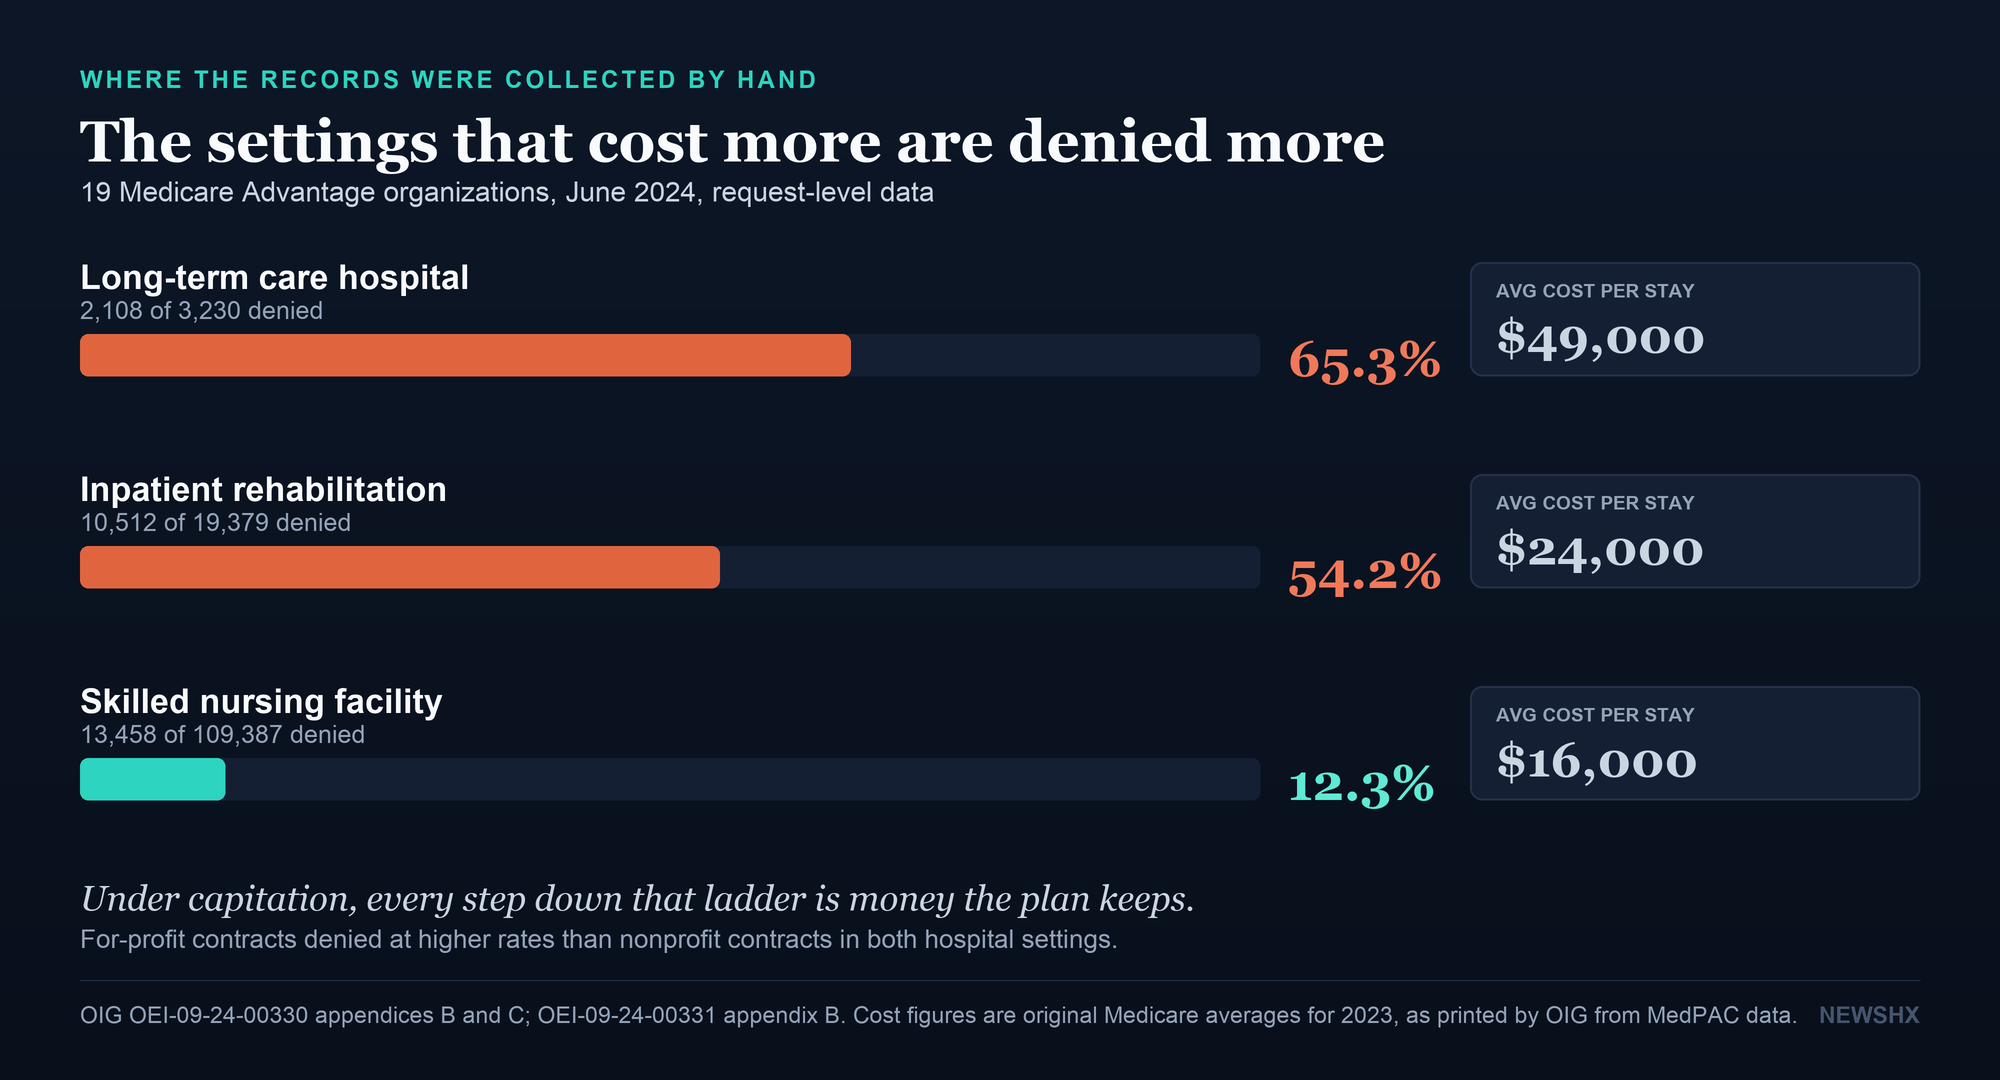
More than half of all requests for inpatient rehabilitation were denied. Nearly two-thirds of requests for long-term acute care were denied. And the three largest plans by enrollment were among the worst: UnitedHealth Group denied 65.8% of IRF requests, Humana 53.5%, CVS Health 50.7%. On LTCH, CVS denied 79.6%, Humana 72.3%, UnitedHealth 70.9%.3
Set that against the skilled nursing number from the companion report: 12%.4 Same patients, same discharge decision, same month. The setting that costs more is denied four to five times as often. The cost ladder OIG prints is the whole explanation. In original Medicare in 2023, the average stay cost $49,000 in an LTCH, $24,000 in an IRF, $16,000 in a SNF, and $6,000 in home health.3 Under capitation, every step down that ladder is money the plan keeps. OIG also found that for-profit MA contracts denied at higher rates than nonprofit contracts in both settings, 67.2% versus 38.7% for LTCH and 55.2% versus 43.9% for IRF, and noted that the three largest MAOs operated only for-profit contracts at the time of review.3
That internal comparison is the cleanest one available, because it holds the month, the plans and the patients constant. KFF ran an external one in July and reached the same place from a different direction, setting the OIG post-acute rates against an overall Medicare Advantage denial rate of under 8% across all services.12 That benchmark comes from 2024 Part C reporting-requirements data, a third vintage again, so it is an order-of-magnitude check rather than a like-for-like one. It survives the caveat. Post-acute is not denied somewhat more often than everything else. It is denied several times more often.
The Senate Permanent Subcommittee on Investigations reached the same conclusion two years earlier, with company-level data. Its October 2024 majority staff report found that in 2022 UnitedHealthcare and CVS denied post-acute requests at roughly three times their own overall denial rates, and Humana at more than 16 times its own, and it documented the algorithmic review tools the three had deployed between 2019 and 2022.8 Those are the same three companies OIG would later rank at the top of the LTCH and IRF denial tables. The pattern was named, in public, by a Senate subcommittee, before the transparency rule that failed to measure it took effect.
The variation that proves the rate is not the story
Here is the finding that should end the practice of ranking insurers by denial rate. In June 2024, CVS Health denied 50.7% of IRF requests and overturned 81.6% of the appeals it received. Humana denied 53.5% and overturned 14.1%.3
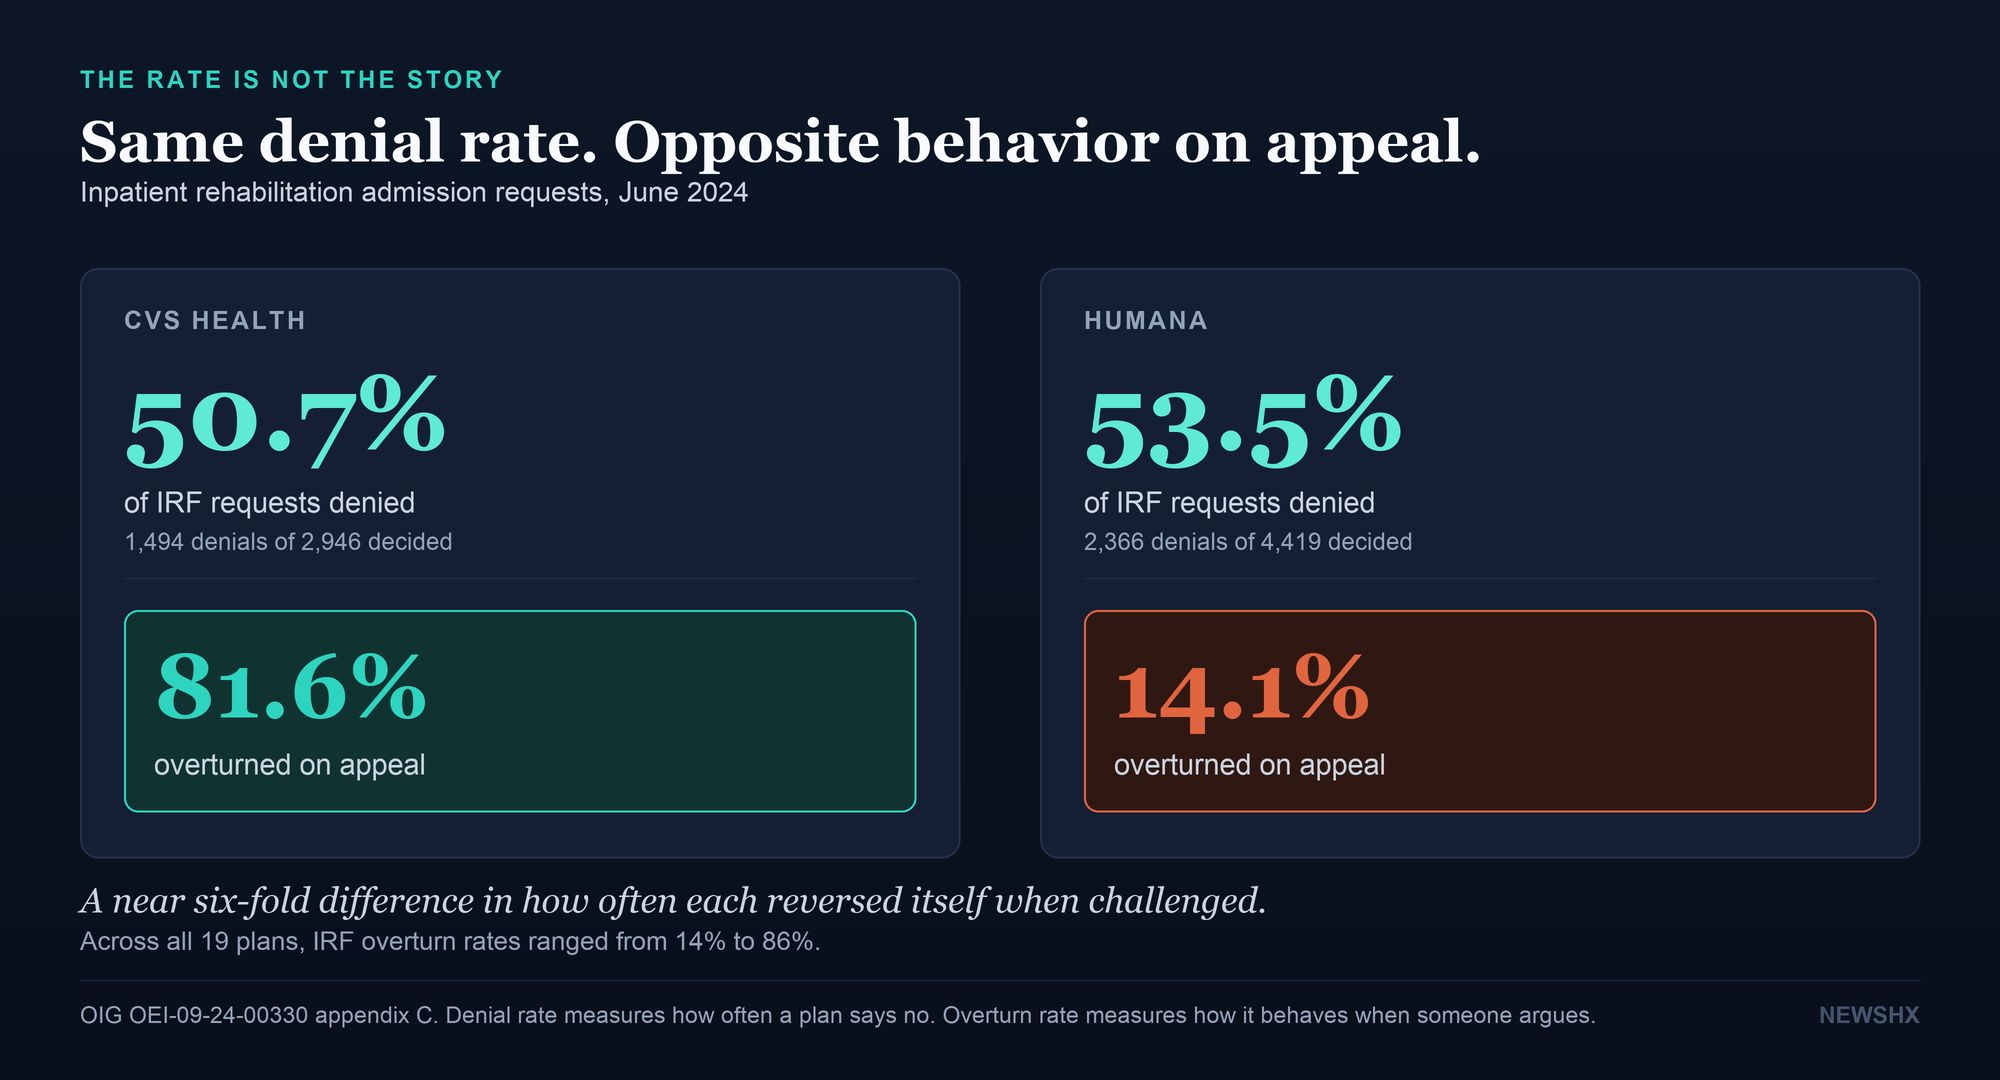
Two large insurers denied inpatient rehab at nearly the same rate. One reversed itself 82% of the time on appeal; the other, 14%. The denial rate told you nothing about whether the denials were right.
Across all 19 plans, IRF overturn rates ranged from 14% to 86%.3 A denial rate measures how often a plan says no. An overturn rate measures how a plan behaves when someone argues. They are not the same quantity and neither one, alone or together, tells you how many patients were wrongly denied. CMS-0057-F publishes exactly these two numbers and nothing that would let you connect them.
Most of these patients never appealed
Now the part that is not being reported. OIG counted the appeals. Of 10,512 IRF denials, 3,295 were appealed. Of 2,108 LTCH denials, 754 were appealed.3 That is an appeal rate of 31% for inpatient rehab and 36% for long-term acute care, far above the roughly 1% OIG found across all Medicare Advantage denials in 2014 to 2016,5 which makes sense: a hospital case management team is a far more capable advocate than a patient alone. Skilled nursing runs the other way. Only 18% of those denials were appealed, and when they were, MAOs overturned 95% of them.4
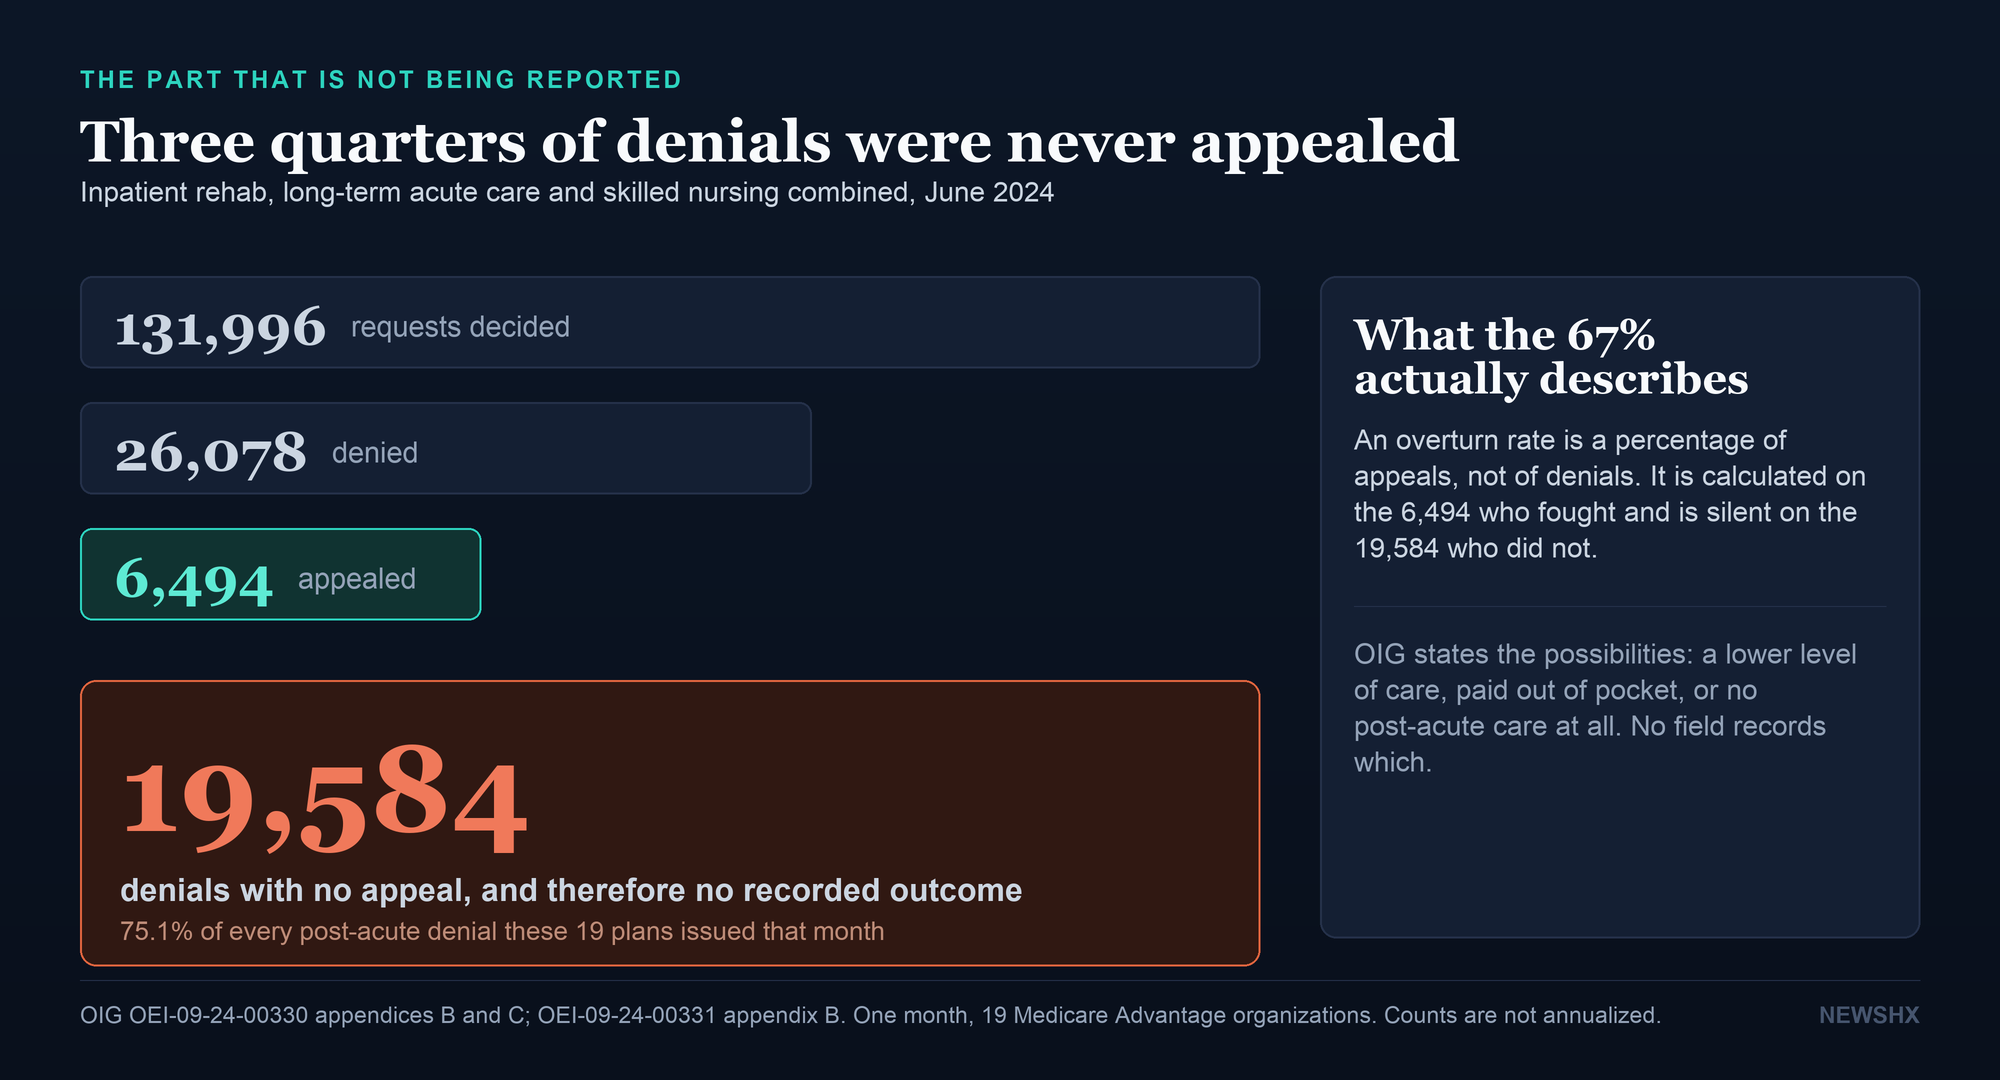
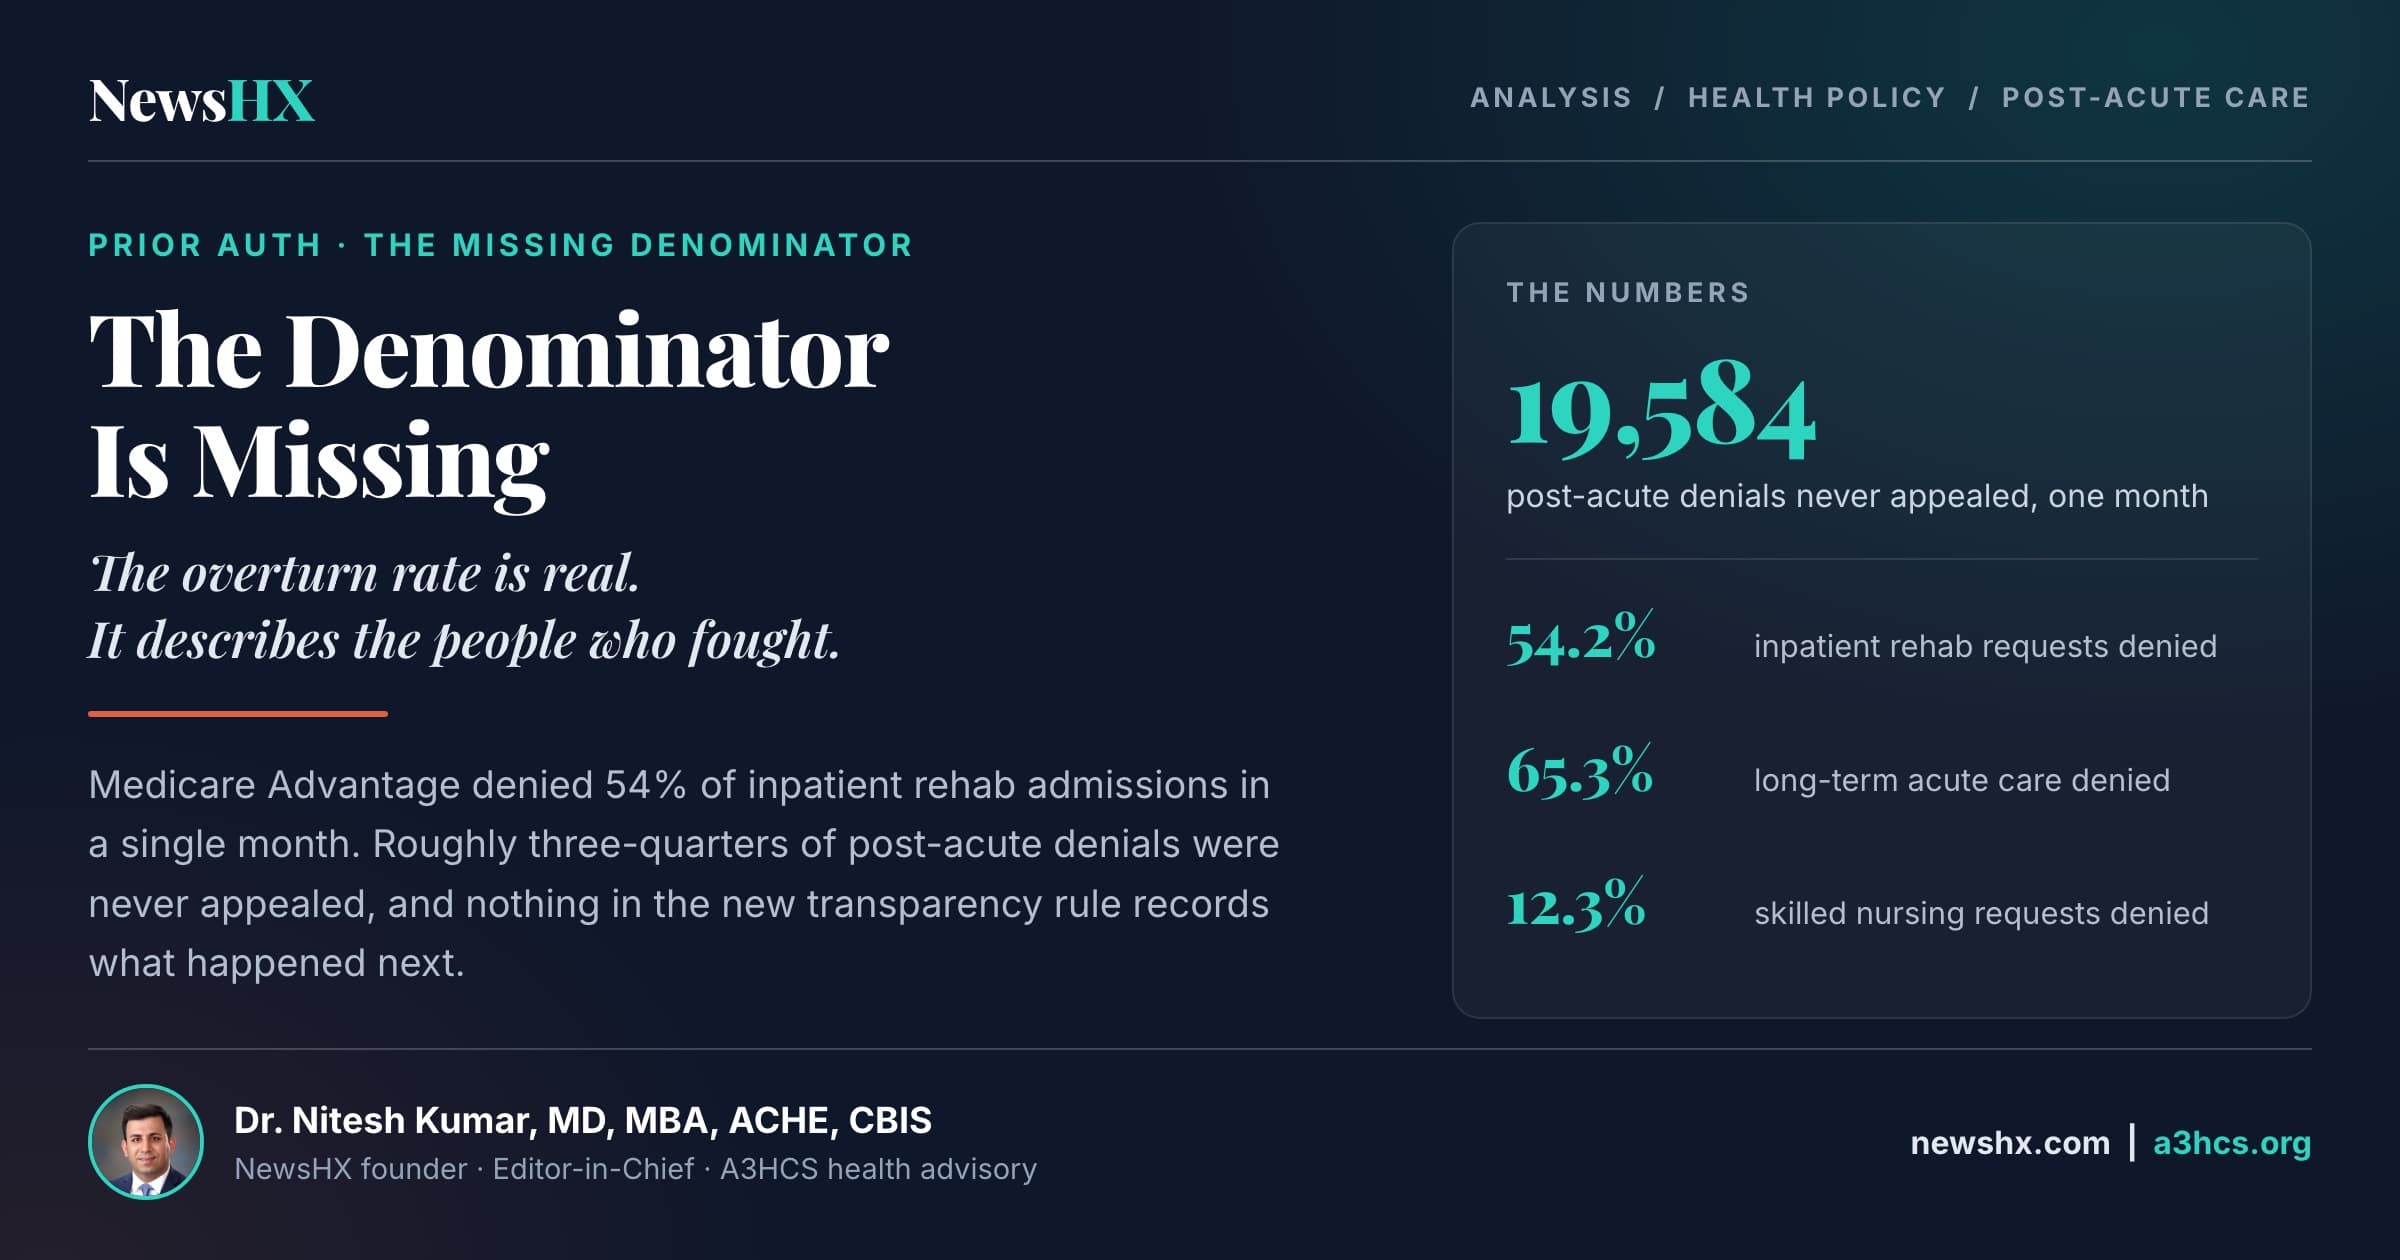
It still leaves, in one month, across 19 plans: 7,217 inpatient rehabilitation denials never appealed, 1,354 long-term acute care denials never appealed, and 11,013 skilled nursing denials never appealed. 19,584 post-acute denials in total, roughly three-quarters of every denial these plans issued that month, with no appeal and therefore no recorded outcome. What happened to those patients? OIG does not speculate. It states the possibilities directly.
For the patients who did not appeal LTCH or IRF denials, they may have requested a lower level of care (e.g., SNF care or home health), paid for LTCH or IRF care out of pocket, or gone without post-acute care.
That sentence is the whole argument, and a federal watchdog wrote it, not an advocate. Resist the tempting arithmetic here. It is not legitimate to apply the 42.7% overturn rate to those 7,217 unappealed IRF denials and announce that 3,000 patients were wrongly denied rehab. People who appeal are a self-selected group, better represented and quite possibly holding stronger cases. That inference is exactly the error that lets a payer discredit an otherwise well-sourced argument, and it is unnecessary. The honest claim is stronger and more damning: we do not know what happened to those patients, because no reporting system in American healthcare is built to record it.
A denial that becomes a discharge is invisible by design
This is the structural point, and it is where the post-acute setting differs from every other place prior authorization operates. If a plan denies a specialty drug, the patient does not get the drug. The gap is visible. The prescription sits unfilled. Somebody notices.
If a plan denies inpatient rehabilitation for a patient with a new brain injury, the patient does not stay in the hospital indefinitely and does not go home to nothing. The discharge planner works the next option down. The patient goes to a skilled nursing facility. In the record, that is a completed discharge to an appropriate post-acute setting. The bed was found. The transition happened. The quality measure closes.
Nothing in the system codes that as the outcome of a denial. The plan's published metrics show a denial and, if nobody appealed, no appeal. The SNF's records show an admission. The hospital's records show a discharge. There is no field anywhere that says this patient is here because a different level of care was refused.
In post-acute care, a denial does not create a visible gap. It creates a substitution. The patient went somewhere, so the system records success.
And the ladder has a fourth rung nobody counted. OIG's own cost table runs long-term acute care, inpatient rehabilitation, skilled nursing, then home health at $6,000 a stay,3 and OIG names home health explicitly as one of the places a denied patient may end up. But the request-level collection stopped at skilled nursing. Neither brief gathered home health prior authorization data, so for the cheapest setting on the ladder there is no denial rate, no appeal count, and no denominator at all. The rung most likely to absorb a downgraded patient is the one measured least.
And the substitution is not clinically neutral. IRFs and SNFs are not two flavors of the same thing. Medicare's own coverage criteria draw the line. To be covered, an inpatient rehabilitation facility stay must involve multiple therapy disciplines and an intensive rehabilitation therapy program, which the regulation defines as generally at least three hours of therapy per day at least five days per week, with a rehabilitation physician conducting face-to-face visits at least three days a week and leading a weekly interdisciplinary team that includes a rehabilitation-trained registered nurse.9 That intensity is the treatment. For the patients I have spent my career with, people recovering from traumatic brain injury, stroke, and complex neurological insult, the difference between three hours of coordinated therapy a day and a lower-intensity nursing setting is frequently the difference between going home and not.
The clinical literature backs the timing, and OIG cites it. Bradley and Wheelwright, in Clinical Rehabilitation in 2024, reviewed 235 consecutive admissions to a specialist brain injury rehabilitation service and found that longer waits from injury to admission were significantly associated with reduced rehabilitation efficiency (rs = -0.240, p = 0.0002) and less reduction in care needs (rs = -0.246, p = 0.0001). The association was strongest in exactly the patients who wait longest for a bed: those with a tracheostomy (rs = -0.362, p = 0.013) and those who had undergone intracranial surgery (rs = -0.344, p = 0.0006). It is a retrospective observational series at a single UK service, so it establishes association rather than cause, and the setting is not a US IRF. The direction is nonetheless the one every rehabilitation clinician would predict, and OIG cites it for that reason.6
Even for the patients who win, that win is not free. The median time from initial request to appeal decision was 5 days for IRF and 6 days for LTCH, with 8% of IRF appeals and 16% of LTCH appeals taking 10 days or more.3 Those days are spent in an acute hospital bed, accruing deconditioning and infection risk, and they are days the plan does not reimburse the hospital for.3
The fix is already written down, and CMS did not agree to it
OIG made two recommendations. The first is the one that matters: CMS should "regularly collect request-level prior authorization data that include service type and contractor information."3
That is a precise description of what CMS-0057-F does not require and what the 2026 proposed rule still does not add.2 OIG had to go collect these records from 19 companies by hand to learn that Medicare Advantage denies more than half of inpatient rehab admissions, because no routine reporting stream would have surfaced it. CMS did not explicitly concur or nonconcur with either recommendation.3
The contractor half of that recommendation is not incidental either. naviHealth, a subsidiary of UnitedHealth Group, processed half of all SNF admission requests in the companion study and denied 14% of them, against 11% for MAOs reviewing internally and 9% for other contractors. MAOs then overturned 97% of naviHealth's SNF denials that were appealed.4 Under the current rule, a contractor's performance is invisible. The metrics are posted at the contract level, and the entity actually making the decision does not appear.
From the field · Dr. Kumar
What would make the next reporting year mean something. Publish counts, not just rates. A denominator turns a percentage into a fact, and without request volume a 12% denial rate at a plan covering 9 million lives and a 12% rate at a plan covering 200,000 are presented as equivalent. Publish the number of appeals. Without it no overturn rate can be interpreted, which is the whole problem with the number that led the coverage. Report by service category, and separate the post-acute settings from each other. IRF, LTCH, and SNF are different decisions with different economics and different clinical stakes, and a single prior authorization bucket hides a 54% denial rate inside a 12% average. Attribute decisions to the reviewing entity, including delegated contractors, because right now the organization making the call does not appear anywhere in the published data. Track and report the level of care ultimately delivered after a denial. The first four are OIG's ask, or close to it. The fifth is mine, and it is the only one that would make level-of-care downgrade visible. Nobody currently collects it.
The bottom line
The prior authorization data released this year is a real advance and it is being read badly. A 67% overturn rate is not a measure of how often plans are wrong. It is a measure of what happens to the subset of patients who had someone able to argue on their behalf, reported without the denominator that would let you weigh it.
Where the underlying records have actually been examined, the picture is considerably darker than the published percentages suggest: more than half of inpatient rehabilitation requests denied, nearly two-thirds of long-term acute care requests denied, 12% of skilled nursing requests denied, and a cost ladder that explains the ranking exactly. Across all three settings, roughly three-quarters of those denials were never appealed, about 19,600 of 26,100 in a single month, and by the federal watchdog's own account those patients likely stepped down to a cheaper setting, paid out of pocket, or went without.
For a patient recovering from a brain injury, that step down is not an administrative detail. It is the plan of care. And under the transparency regime we just built, it does not register as anything at all.
Are your denials, appeals, and post-acute placements telling you the same story?
A3HCS helps hospitals, health systems, and post-acute providers instrument what the payer metrics do not: level-of-care downgrade after denial, appeal capture rates by service line, contractor-level denial patterns, and the avoidable-day cost of authorization delay.
References
- Centers for Medicare & Medicaid Services. *CMS Interoperability and Prior Authorization Final Rule (CMS-0057-F).* Fact sheet, 2024. First public reporting deadline March 31, 2026, covering calendar year 2025. cms.gov/newsroom/fact-sheets/cms-interoperability-prior-authorization-final-rule-cms-0057-f
- Long M, Fuglesten Biniek J, Lo J, Wallace R, Raphael J, Kim A, Pestaina K. *Prior Authorization Metrics Provide New Insights into Insurer Practices, but Gaps Remain.* KFF, August 13, 2026. kff.org/patient-consumer-protections/prior-authorization-metrics-provide-new-insights-into-insurer-practices-but-gaps-remain
- U.S. Department of Health and Human Services, Office of Inspector General. *The Three Largest Medicare Advantage Organizations Denied Requests for Long-Term Acute Care and Inpatient Rehabilitation at Some of the Highest Rates.* Data Brief, OEI-09-24-00330, June 2026. Request-level data from 19 MAOs, June 2024. Volumes at appendices B and C. oig.hhs.gov/documents/audit/11693/OEI-09-24-00330.pdf
- U.S. Department of Health and Human Services, Office of Inspector General. *Medicare Advantage Organizations Overturned Nearly All Appealed Prior Authorization Denials for Skilled Nursing Facility Admission, Raising Concerns About Initial Denials.* Data Brief, OEI-09-24-00331, June 2026. Companion brief. SNF volumes at appendix B. oig.hhs.gov/documents/audit/11694/OEI-09-24-00331.pdf
- U.S. Department of Health and Human Services, Office of Inspector General. *Medicare Advantage Appeal Outcomes and Audit Findings Raise Concerns About Service and Payment Denials.* OEI-09-16-00410, September 2018. During 2014 to 2016, beneficiaries and providers appealed only 1 percent of denials to the first level of appeal. oig.hhs.gov/reports/all/2018/medicare-advantage-appeal-outcomes-and-audit-findings-raise-concerns-about-service-and-payment-denials
- Bradley L, Wheelwright S. The impact of delays in transfer to specialist rehabilitation on outcomes in patients with acquired brain injury. *Clin Rehabil.* 2024;38(11):1552-1558. doi:10.1177/02692155241284866. PMID 39318331
- Medicare Payment Advisory Commission. *A Data Book: Healthcare Spending and the Medicare Program,* July 2025; and *Report to the Congress: Medicare Payment Policy,* March 2025. Source of the per-stay cost figures printed by OIG.
- U.S. Senate Permanent Subcommittee on Investigations, Majority Staff Report. *Refusal of Recovery: How Medicare Advantage Insurers Have Denied Patients Access to Post-Acute Care.* October 17, 2024. hsgac.senate.gov/wp-content/uploads/2024.10.17-PSI-Majority-Staff-Report-on-Medicare-Advantage.pdf
- *IRF coverage criteria.* 42 C.F.R. § 412.622(a)(3)(ii), (a)(3)(iv), and (a)(5). Source of the three-hour therapy standard, the three-days-per-week rehabilitation physician visit requirement, and the weekly interdisciplinary team composition. ecfr.gov/current/title-42/section-412.622
- American Medical Association. "On prior auth, CMS responds to AMA concerns." Press release, August 17, 2026. Review of 15 Medicare Advantage contracts; the underlying AMA letter is dated May 22, 2026. ama-assn.org/press-center/ama-press-releases/prior-auth-cms-responds-ama-concerns
- Centers for Medicare & Medicaid Services. *Prior Authorization Metrics Reporting Overview Template*, revised August 2026. Revisions described in reference 10 and in Healio, "CMS updates guidance on prior authorization transparency," August 19, 2026. healio.com/news/primary-care/20260819/cms-updates-guidance-on-prior-authorization-transparency
- Fuglesten Biniek J, et al. *Medicare Advantage Insurers Deny Prior Authorization Requests for Post-Acute Care at Substantially Higher Rates Than the Overall Denial Rate.* KFF, July 6, 2026. The under-8% all-services benchmark is 2024 Part C reporting-requirements data, a separate vintage from both the OIG pull and the CY2025 public postings. kff.org/medicare/medicare-advantage-insurers-deny-prior-authorization-requests-for-post-acute-care-at-substantially-higher-rates-than-the-overall-denial-rate