


Picture the couple everyone in healthcare should be thinking about. They are 68 and 71, they sold a house in an expensive coastal metro, and they bought more land and a newer house forty minutes past the last ring of suburbs, in a county that did not exist on most people's mental map five years ago. Jasper County, South Carolina. Kaufman County, Texas. Jackson County, Georgia 3. The taxes are lower, the lot is bigger, and the drive to a tertiary hospital with a stroke team, an interventional cardiologist, or an inpatient rehab bed is now measured in tens of miles, not minutes.
That couple is not an anecdote. They are the dominant pattern in the Vintage 2025 estimates. Among counties with 20,000 or more people, nine of the ten fastest-growing in the nation between 2024 and 2025 were in the South, and 45 of the top 50 were 2. The growth clustered on the outer edges of Southern metros, a pattern the Census Bureau flagged as especially pronounced in Texas 2. And the age group moving fastest into those edges is the one that consumes the most healthcare.
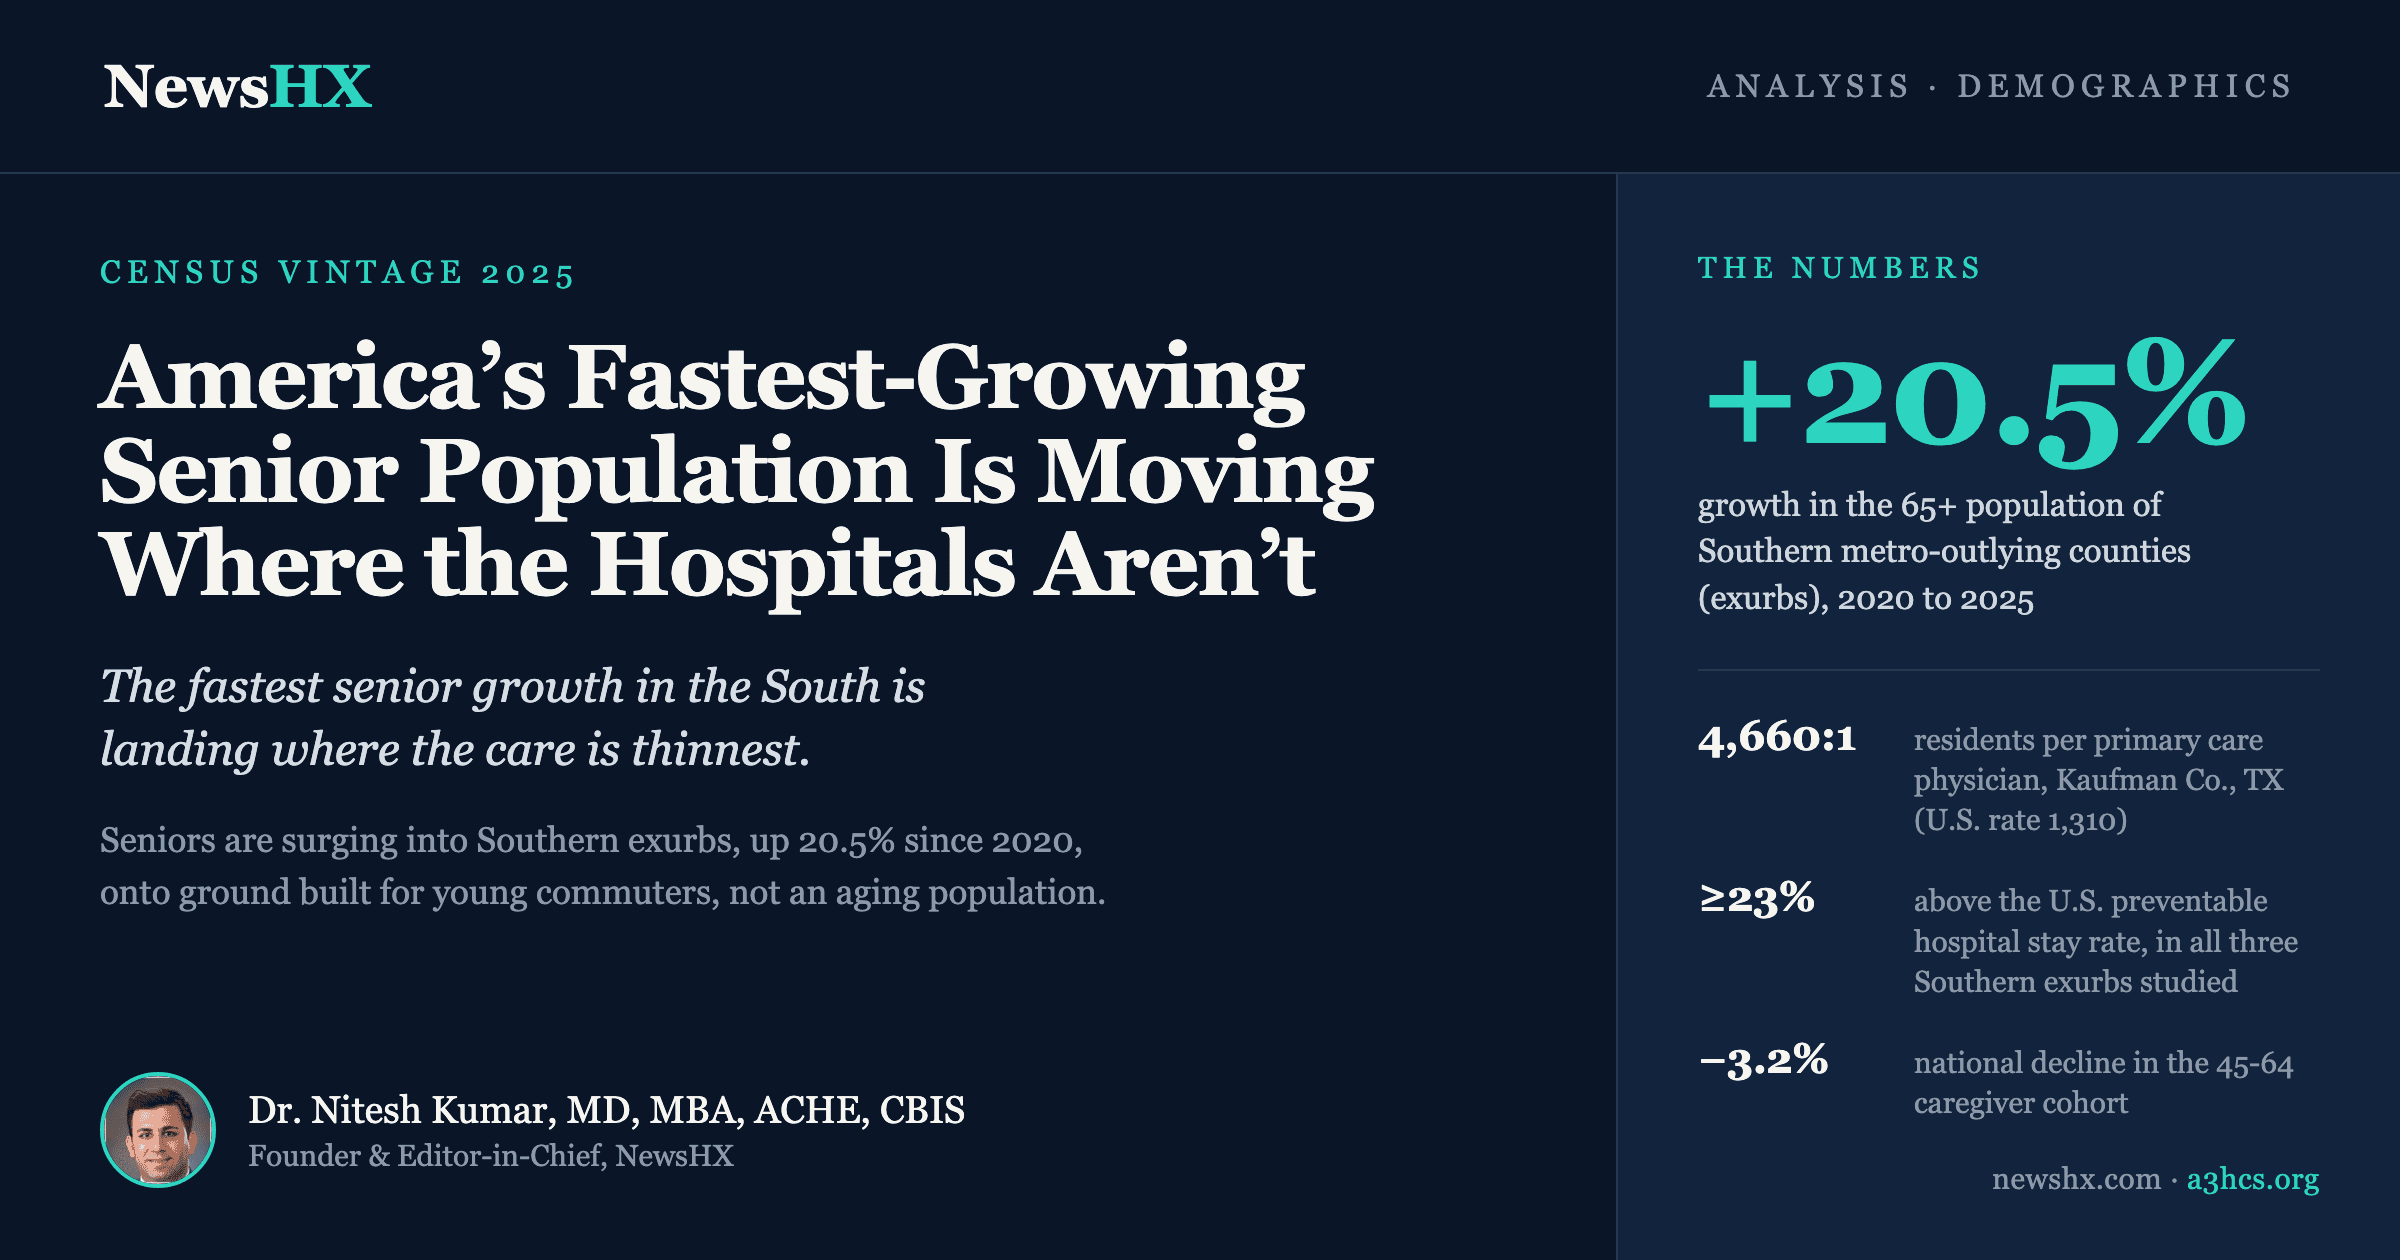
The 65-and-older population in the outlying counties of Southern metros grew 20.5% in five years. It is the fastest senior growth of any county type in the South, the fastest-growing region in the country, and it is happening where the care infrastructure is thinnest.
Read that the way an operator would. Demand for geriatric, cardiac, neurologic, and post-acute care is compounding in places that were zoned, staffed, and capitalized for young commuting families. This piece is about the collision between those two facts, why it is worse than the top-line numbers suggest, and what health systems, clinicians, and communities can actually do while there is still a planning window.
What the Census actually found
Strip the release to its load-bearing numbers. The national population reached 341.78 million by July 1, 2025, up 3.1% since April 2020 1. The median age rose to 39.4 years. The 65-and-older population grew 16.2% nationally, an increase of roughly 9 million people 1, as the baby boomers age in. That much is the expected story of a graying country.
The geography is where it gets specific. The South grew 6.0%, nearly double the national rate, and was the only region to grow in all five age groups 1. Inside the South, the Census Bureau's own county-type breakdown tells the real story:
South by county type, 2020 to 2025 (total / 65+ growth). Metro, central counties: +6.1% total / +18.6% among 65+. Metro, outlying counties (exurbs): +10.7% total / +20.5% among 65+ 1. Micropolitan, central counties: +2.8% total / +12.6% among 65+. Outside metro/micro: +1.0% total / +10.5% among 65+.
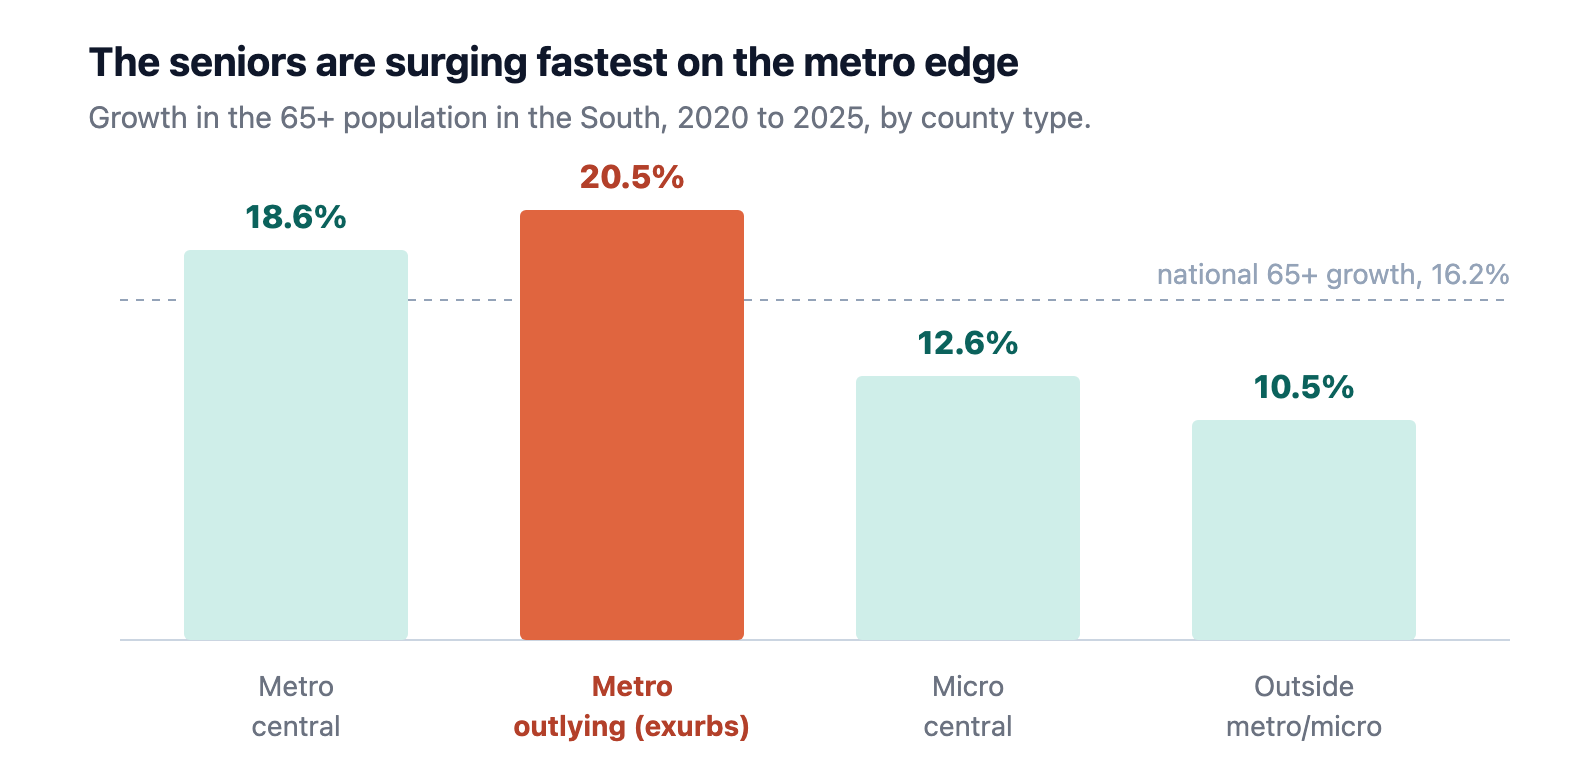
The exurban ring is growing fastest overall and graying fastest at the same time. This is not the classic retirement story of seniors clustering into dense, service-rich Sun Belt cities. It is seniors dispersing outward, into counties that read as suburban or semi-rural, ahead of the infrastructure that a dense older population requires.
The exurbs are not filling up only with young families priced out of the metro. They are filling up with their parents. The county that grew fastest also aged fastest, and that combination is the one the care system is least prepared for.
Why the exurbs are the hard case
There is a comfortable assumption that America already knows how to serve older people who move to the edge of things, because we have spent decades building rural health policy. The exurbs break that assumption in a specific and dangerous way. They are not rural, and that is the problem.
A classic rural county is thin on providers, but it is visible to the policy system built to help it. It can hold a Critical Access Hospital designation, qualify for rural health clinic status, draw on federal rural funding streams, and appear on every shortage map 9. A fast-growing exurban county sitting inside a metropolitan statistical area often does none of that. It is administratively metropolitan, so it is frequently invisible to rural-designed support, while on the ground it has the provider density of a rural county and a population growing far faster than any rural county ever does.
The density gap is stark. Rural areas average about 98 active physicians per 100,000 people, against 286 per 100,000 in urban areas, close to a three-to-one difference, with the national average across all ZIP codes sitting at 263 6. Exurban counties on the outer metro ring frequently sit closer to the rural end of that range than the urban one, because the hospitals, specialist practices, and imaging centers stayed clustered in the metro core where they were built. When 20% more seniors arrive in five years, they do not bring a cardiologist, a neurologist, or a skilled nursing facility with them. They inherit whatever thin network was already there and divide it by a larger number.
A fast-growing exurb has the provider density of a rural county and the growth rate of a boomtown, but because it is administratively metropolitan, it is often invisible to the rural health policy built to catch exactly this.
The three counties from the top of this piece are not rhetorical. They are on the record, they are all drawn from the same County Health Rankings dataset, so they are directly comparable to each other and to their states, and they read best as three stages of the same process.
Three fast-growing exurbs, one process at three stages (County Health Rankings, March 2026 data update; residents per one provider).11,12,13,16 Kaufman County, TX (Dallas exurb, the fastest-growing county in Texas since 2020, up 44.0% 33). Senior share is still only 10.4%, well under the national 17.7%. This is the runway case, the surge is arriving and has not landed. Primary care already runs 4,660 to 1, against 1,640 statewide and 1,310 nationally. Mental health runs 842 to 1 against 553 in Texas. Jackson County, GA (Athens and Atlanta exurb). Senior share 14.7%, the midpoint. Primary care is the best of the three at 1,790 to 1, though still thinner than Georgia's 1,490. Mental health is the worst of the three at 1,422 to 1, nearly three times Georgia's 499. And Jackson has had no hospital of its own since Northridge Medical Center in Commerce closed its acute-care operation in October 2020 35. Jasper County, SC (Savannah and Hilton Head exurb). Senior share is already 25.0%, one in four residents, far above the national 17.7%. This is the destination case, what the others become. Primary care runs 4,580 to 1 against 1,480 statewide, and the state counted nine primary care physicians in the entire county in 2023 14. Its one hospital is a 41-bed community hospital in Hardeeville, and in 2023 only 38.8% of residents' hospital discharges came from a hospital inside the county 14.
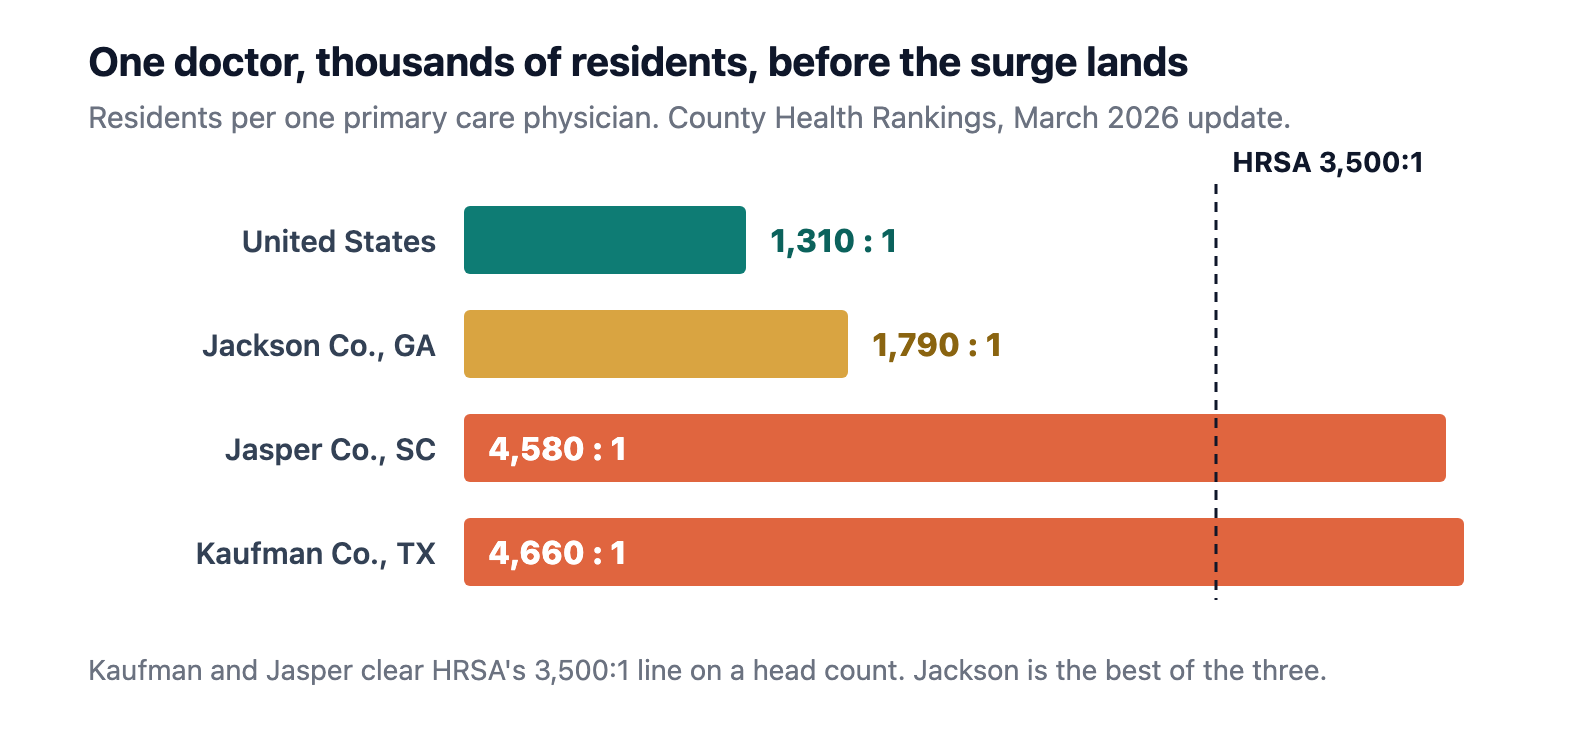
Two things about that box deserve to be said plainly, because both cut against the standard read.
These are not poor counties. Median household income in Kaufman is $90,064 and in Jackson $84,439, both above the national $77,719 16. Jasper, at $61,816, is the only one below. The scarcity here is not a demand-side affordability story, it is a supply-side siting story. These households can pay. There is no one within a reasonable drive to pay.
And advanced practice is not quietly filling the gap. The usual rebuttal to a bad physician ratio is that nurse practitioners and physician assistants absorb it. Run that measure and the floor drops out. The ratio of population to primary care providers other than physicians is 2,174 to 1 in Kaufman and 1,875 to 1 in Jasper, against 682 to 1 nationally 16. The backstop workforce is thinner than the workforce it was supposed to back up. Dentists tell the same story, 2,579 to 1 in Kaufman against 1,341 nationally, and oral health is not cosmetic in this population, it drives nutrition and aspiration risk.
The outcome data is already in, and it is bad
Access ratios are an input measure. They describe what is available, not what happens to people. The reasonable objection to everything above is that a thin provider count might not actually hurt anyone, because patients travel, families adapt, and systems route around gaps.
Test that objection against outcomes, and it fails.
The cleanest available test is preventable hospital stays, the county-level measure of hospitalizations for ambulatory care sensitive conditions: diabetes, pneumonia, urinary tract infection, heart failure, chronic obstructive pulmonary disease and the rest of the AHRQ Prevention Quality Indicator set 26. These are admissions that timely outpatient care is supposed to prevent. The measure is calculated per 100,000 Medicare enrollees, so it is a direct read on the population this article is about, and a high rate is the standard epidemiologic signal for inadequate ambulatory access.
Preventable hospital stays, per 100,000 Medicare enrollees (County Health Rankings, March 2026 data update).16 Kaufman County, TX: 3,422, against Texas's 2,991 and a national 2,769. 24% above the U.S. rate. Jasper County, SC: 3,406, against South Carolina's 2,612 and a national 2,769. 23% above. Jackson County, GA: 3,403, against Georgia's 3,147 and a national 2,769. 23% above. All three exceed both their state and the nation, as they also did in the prior data year. Source: County Health Rankings, AHRQ Prevention Quality Indicator methodology.
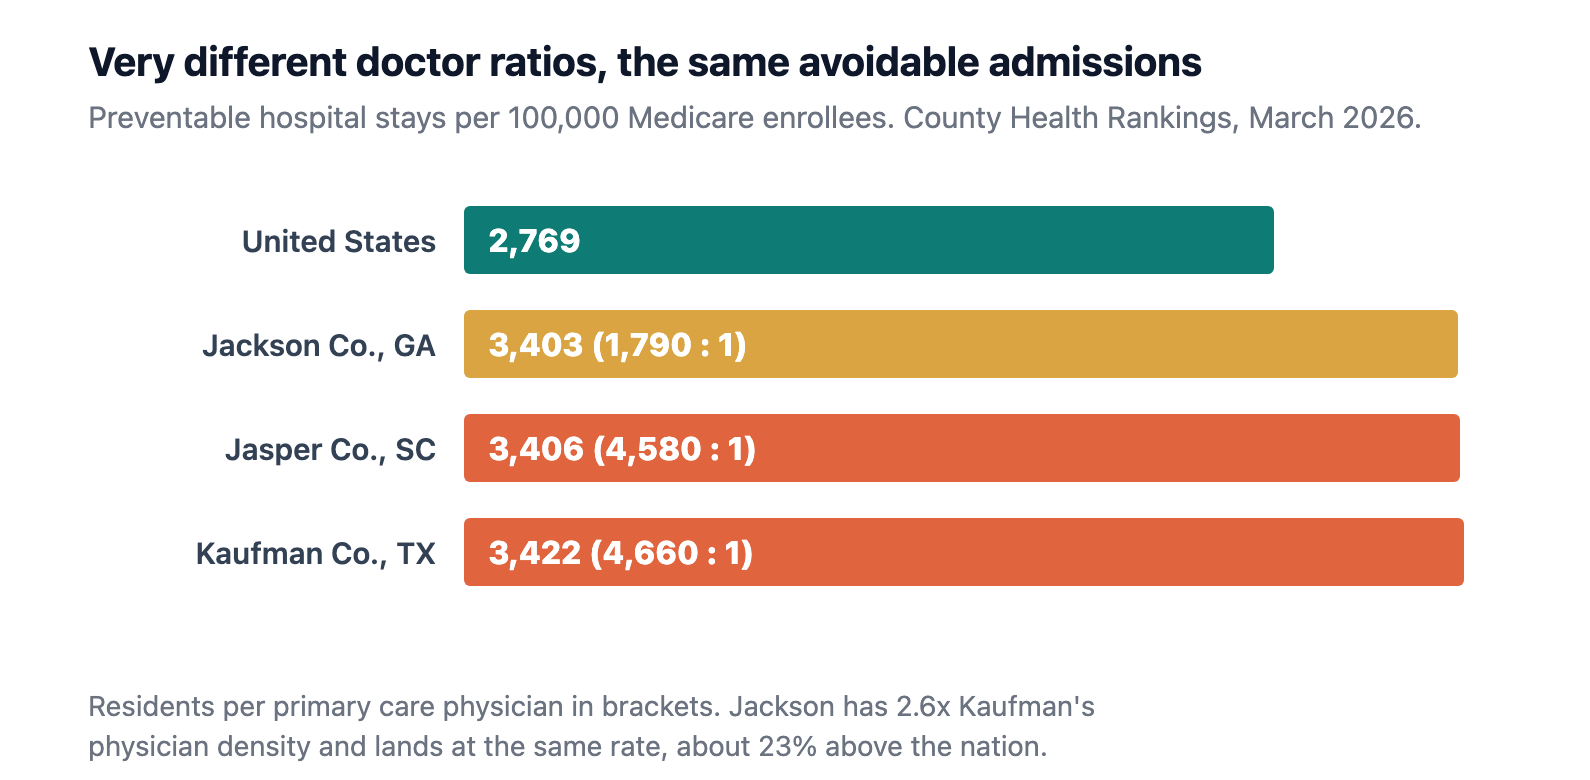
Now set those three rates against the primary care ratios above. Kaufman runs 4,660 residents per primary care physician and Jasper 4,580. Jackson runs 1,790, more than two and a half times the physician density of Kaufman. All three land within 19 admissions of each other, about 23% above the national rate. The county that looks healthiest on the input measure does no better on the output measure.
These are single-year rates in small counties, and they move. Jasper's rose by nearly a quarter between the two most recent data years. What has held across both years is the part that matters: all three sit above their state and the nation.
Jackson County has more than two and a half times the primary care density of Kaufman County and the same preventable hospitalization rate. Counting providers is not the same as measuring access, and the exurbs are where that distinction stops being academic.
That pattern should change how systems plan for these markets. A provider count is not an access measure. It says nothing about whether those providers take Medicare, have open panels, offer appointments inside a clinically useful window, sit within a drivable distance of the people who need them, or connect to anywhere a positive result can be worked up. Jackson County has physicians. What it appears to lack is a functioning ambulatory system, and since 2020 a hospital of its own 35. The admissions are where the difference shows up.
The rest of the outcome picture points the same way. Life expectancy in all three counties runs 1.6 to 4.3 years below the national 77.6 years: Kaufman 75.4, Jasper 73.3, Jackson 76.0 16. Premature age-adjusted mortality is above the national rate in all three. And the geography that defines an exurb has its own body count: motor vehicle crash deaths run 19.5 per 100,000 in Kaufman, 16.5 in Jackson and 35.8 in Jasper, against 12.5 nationally, while Jasper's all-cause injury death rate of 145 per 100,000 sits two-thirds above the national 87 16. A care model that depends on older adults driving themselves thirty or forty minutes to every appointment is not a neutral design choice in counties with those numbers.
One more input that quietly caps everything else. Under 65, the uninsured rate runs 17.5% in Kaufman, 15.7 in Jasper and 12.7 in Jackson, against 9.5% nationally 16. That is the near-elderly cohort, the 55-to-64-year-olds who are about to age into Medicare. In these counties an unusually large share of them will arrive at 65 with undiagnosed or undertreated chronic disease and present to a system that is already short. The exurban senior surge is not only a migration story. It is also a cohort aging in place into Medicare from a decade of thin coverage.
The Midwest gets the aging without the growth
Everything above is Southern, because that is where the Census found the growth. The fair question for anyone running a health system outside the South is whether this is a regional story or a national one wearing a Southern costume.
Run the same measures on the Chicago collar counties and the Wisconsin exurbs and the answer is specific. The surge is national. The growth that pays for it is not.
Start with the totals, from the same Vintage 2025 series 33,34. Illinois lost population between 2020 and 2025, down 0.8%, with Cook County down 1.6%. Wisconsin grew 1.3%. Against Kaufman County's 44.0%, Jasper's 33.7% and Jackson's 30.7%, neither state is in the same conversation.
Now look at the 65-and-older line in the same places, and it inverts.
Total growth vs 65+ growth, 2020 to 2025.33,34 Illinois: total -0.8%, 65+ +13.8%. Wisconsin: total +1.3%, 65+ +17.2%. Kendall County, IL (Chicago exurb): total +10.3%, 65+ +26.1%. St. Croix County, WI (Twin Cities exurb): total +5.1%, 65+ +26.9%. Pierce County, WI (Twin Cities exurb): total +3.1%, 65+ +25.9%. McHenry County, IL: total +2.4%, 65+ +24.2%. Will County, IL: total +2.1%, 65+ +21.5%. For reference, the Southern metro-outlying figure that anchors this article is +20.5% 1.
Read that box against the Southern number. All five counties grew their 65+ population faster than the 20.5% Southern exurban average, Kendall by 26.1% and St. Croix by 26.9%, while their total populations moved a fraction as much and their states barely moved at all.
That is the finding. The exurban senior surge is not a Southern phenomenon. What is Southern is the growth that arrives with it. A Sun Belt exurb absorbing a 20% senior increase is also absorbing a 44% increase in total population, and that brings rooftops, a tax base, commercial development and a business case for siting a clinic. Kendall County is absorbing a larger senior increase on a 10% total increase. Will and McHenry are absorbing theirs on almost none. Illinois has to fund the same demand curve out of a shrinking population.
The access measures say this is not hypothetical.
Illinois and Wisconsin exurbs on the same three measures (County Health Rankings, March 2026 data update).16 Will County, IL. Primary care 1,820 to 1, thinner than Illinois's 1,220 and the national 1,310, but far better than Kaufman, Jasper or neighboring Kendall. Preventable hospital stays 3,941 per 100,000 Medicare enrollees, 42% above the national 2,769, the worst in the Chicago collar and the worst of any county in this article. Median household income $103,587. St. Croix County, WI. Primary care 1,920 to 1. Preventable stays 2,994, 8% above the nation and 15% above Wisconsin's 2,596. Median household income $103,731. Life expectancy 79.8 years, above the national 77.6. Kendall County, IL. Senior share still only 11.5%, so this is the runway case, the Kaufman of the Midwest. Primary care 3,430 to 1, 2.8 times Illinois's 1,220 to 1. Preventable stays 3,819, 38% above the nation. Highest median household income of any county named here, $114,606, and a life expectancy of 81.2 years. DeKalb County, IL. Primary care 3,710 to 1, which clears HRSA's 3,500-to-1 geographic shortage threshold on a head count 9, in a county that is administratively part of a metropolitan statistical area.
Two of those deserve pulling out.
Will County is the sharpest case in the dataset. Its primary care ratio is unremarkable, thinner than Illinois and the nation but two and a half times denser than Kaufman's. Its households earn more than $100,000 and its residents outlive the national average by nearly two years. And it runs the worst preventable hospitalization rate of any county in this article, 3,941 per 100,000, 42% above the national rate, in a county of 712,000 people 33. Counting providers is not measuring access, and Will County is the cleanest proof of it in the dataset.
Kendall County is the affluence control. Its 65+ population grew 26.1% in five years. Its households have the highest median income of any county named here, and its residents live 81.2 years, more than three and a half years beyond the national average. It still runs preventable hospital stays 38% above the national rate, on a primary care ratio of 3,430 to 1. This is not a poor county or a short-lived one. It is a prosperous, long-lived county, and its ambulatory system is not keeping up anyway.
Kendall County's 65-plus population grew 26.1% and St. Croix County's grew 26.9%, both above the Southern exurban average, while Illinois lost population outright. The surge is national. Only the growth that pays for it is regional.
For a health system in Illinois or Wisconsin, that reframes the problem. The Sun Belt version is a capacity race against in-migration. The Midwest version is the same capacity problem with no in-migration to fund it, in counties whose income and life expectancy make them look, on paper, like the last places that would have an access failure.
Measure it against the national goals, because they are already being missed
Healthcare has a national scoreboard for exactly this population. It is worth putting the exurbs on it, because doing so reveals something about the scoreboard itself.
Healthy People 2030, the decade's federal health objectives, carries a curated older-adult set 17. Read the list as an operator rather than a policy analyst and a pattern jumps out. A large share of the objectives are not about screening rates or health behaviors at all. They are hospital admission measures:
The Healthy People 2030 older-adult objectives that are really access measures.17 OA-04: Reduce the rate of pressure ulcer-related hospital admissions among older adults. OA-05: Reduce the rate of hospital admissions for diabetes among older adults. OA-06: Reduce the rate of hospital admissions for pneumonia among older adults. OA-07: Reduce the rate of hospital admissions for urinary tract infections among older adults. RD-D03: Reduce hospitalizations for asthma in adults aged 65 and over. DIA-02: Reduce the proportion of preventable hospitalizations in older adults with dementia. Every one of these is an ambulatory care sensitive condition. Source: Healthy People 2030, Older Adults custom objective set.
Six national objectives for older adults, all phrased as hospital measures, and every one of them is actually an outpatient capacity measure wearing hospital clothing. Pressure ulcers, uncontrolled diabetes, pneumonia, urinary tract infections and asthma exacerbations are what happens when the layer below the hospital is missing. Which means the national older-adult agenda is, to a first approximation, an ambulatory access agenda, and the county-level proxy for it is precisely the preventable-stays measure the exurbs are already failing.
The falls objectives sharpen it further, and they carry the most uncomfortable number in this piece.
The falls objectives, and the national trend.18,19 OA-03, emergency department visits due to falls among older adults: baseline 6,052.2 per 100,000 adults 65 and over in 2016, with a 2030 target of 5,447. IVP-08, fall-related deaths among older adults: baseline 64.4 per 100,000 in 2018, with a 2030 target of 63.4. The most recent rate for IVP-08, for 2024, is 78.1 per 100,000, well above the 2018 baseline, and ODPHP's own status label reads getting worse. The country is moving away from the target, not toward it.
Sit with that last line. Fall deaths among older adults are rising nationally, against a target that asked only for a one-point improvement, and that trend is the baseline condition into which a 20.5% exurban senior surge is now arriving. The counties absorbing that surge are the ones with the thinnest post-acute networks, the longest drives, and, as shown below, the least access to the one intervention with the strongest evidence behind it.
The access objectives complete the frame. AHS-04 (people who cannot get medical care when they need it), AHS-07 (people with a usual source of care) and AHS-08 (adults who get recommended evidence-based preventive care) are all tracked as showing little or no detectable change nationally 20. Those three are the objectives most directly determined by where a person lives, and they are the three that have not moved.
The preventive services are already free. The delivery assets are not there.
This is where the exurban geography becomes a clinical problem rather than an economic one, and it is the part most often missed in access conversations.
Under the Affordable Care Act, private health plans must cover preventive services that the U.S. Preventive Services Task Force grades A or B without cost sharing, under section 2713 25. Traditional Medicare waives the deductible and coinsurance for the Grade A and B services it covers, under section 4104 36, and section 4106 pays state Medicaid programs a one-percentage-point bonus in federal matching funds to do the same 37. Coverage is not identical across payers. Medicare covers lung cancer screening to age 77 rather than 80 38, statins sit under Part D with ordinary cost sharing, and a community exercise class is not a Part B preventive benefit. But for most of the list that follows, the screening itself is, at the point of service, already paid for.
So the barrier is not the copay. The barrier is that a Grade A or B recommendation is an instruction to deliver something, and delivering it requires a physical asset and a referral pathway that these counties do not have.
Walk the list against the county data.
The Grade A and B services this population is entitled to, and what each one requires on the ground.21,22,23,24 Falls prevention exercise (B, June 2024) needs a place to exercise, and access to exercise opportunities runs 45% in Jackson, 55% in Jasper and 67% in Kaufman, against 84% nationally.16 Depression screening (B, June 2023) needs a diagnosis, treatment or referral destination, a condition written into the recommendation itself, and Jackson runs 1,422 residents per mental health provider, five times the national 287 to 1.16 Osteoporosis screening (B, January 2025) needs a DXA scanner. Abdominal aortic aneurysm screening (B, December 2019) needs an ultrasound and a vascular surgery referral. Lung cancer screening (B) needs an accredited low-dose CT program, a reading radiologist and a shared decision-making visit. Colorectal cancer screening (A, ages 50 to 75) needs a colonoscopy suite a positive stool test reliably reaches. Hypertension screening (A) and statins for primary prevention (B) need routine primary care contact, at 4,660 to 1 in Kaufman and 4,580 to 1 in Jasper.16
All grades are current USPSTF recommendations 21,22,23,24. Section 2713 requires private plans to cover all of them without cost sharing 25; Medicare and Medicaid coverage differs by service 36,37,38.
The first two are worth walking through, because the county data speaks to them directly.
Falls prevention. The USPSTF recommends exercise interventions to prevent falls in community-dwelling adults 65 and older at increased risk, Grade B, updated June 2024, with exercise showing the most consistent benefit across fall outcomes 21. It is the single highest-value preventive intervention for this population and it requires no scanner, no specialist and no drug. It requires a place to exercise. County Health Rankings measures access to exercise opportunities, and it runs 45% in Jackson County, 55% in Jasper and 67% in Kaufman, against 84% nationally 16. In Jackson County, fewer than half of residents have adequate access to the intervention that a national Task Force recommends and federal law already pays for.
Depression screening. The USPSTF recommends screening for depression in adults including older adults, Grade B, June 2023 22. Read the recommendation's own condition: "Adequate systems and clinical staff are needed to ensure that patients are screened and, if they screen positive, are appropriately diagnosed and treated with evidence-based care or referred to a setting that can provide the necessary care." Now set that against 1,422 residents per mental health provider in Jackson County, nearly three times the Georgia rate and five times the national 287 to 1 16. The condition the Task Force attached to its own recommendation is not met on the ground. Screening without a referral destination does not produce treated depression, it produces identified, untreated depression, and in an older population that is a driver of the very falls, readmissions and functional decline this piece is about.
Everything else on the list needs a building. Osteoporosis screening in women 65 and older is Grade B, updated January 2025, and it requires a DXA scanner 23. Lung cancer screening for adults 50 to 80 with a 20 pack-year history who smoke now or quit within 15 years is Grade B and requires an accredited low-dose CT program with a reading radiologist and a shared decision-making visit. Colorectal cancer screening is Grade A from 50 to 75, and a stool-based test only counts if a positive result reliably reaches a colonoscopy suite. Hypertension screening is Grade A and statin therapy for primary prevention in adults with cardiovascular risk is Grade B, both of which need routine primary care contact 24. Every one of those is an asset, a staffed program or a referral pathway, sited somewhere.
The two preventive measures County Health Rankings actually tracks inside the Medicare population show the pattern holding. Mammography screening among Medicare enrollees runs 42% in Kaufman, against 46% nationally. Flu vaccination among Medicare enrollees runs 39% in Jasper, against 44% nationally 16. Modest gaps individually. Consistent in direction, and measured in exactly the cohort that is growing 20.5%.
Federal law already removed the copay from most Grade A and B preventive services. What it could not do is put a DXA scanner, a CT program, a psychiatrist and a place to exercise in a county that does not have them.
The workforce was already short before the surge
Layer the workforce math on top of the geography and the picture darkens.
Start with the specialty built for this exact population. Fewer than 7,000 geriatricians were working in the United States in 2025 4. A 2017 federal projection had demand for geriatricians exceeding supply by nearly 27,000 full-time equivalents by 2025, against a projected supply of about 6,230 5. The specialty designed to manage the complex, multi-morbid older patient is not thin. It is functionally absent from most of the country, and it is thinnest exactly where the 65-plus population is growing fastest.
The generalist workforce that has to absorb the overflow is aging out at the same time. More than half of rural physicians are 50 or older and more than a quarter are at least 60, and the rural physician supply is projected to fall by about 23% by 2030, from about 12 physicians per 10,000 rural residents in 2017 to 9.4 in 2030 32. The exurban ring draws from the same regional labor pool as those rural counties, and it is trying to recruit into it while the pool is shrinking.
Then the safety net underneath all of it is being pulled tighter. Rural hospitals are already under closure pressure: Chartis counts 417 as vulnerable to closure and 41% operating in the red 7. KFF estimates the 2025 federal Medicaid changes will cut federal Medicaid spending in rural areas by roughly $137 billion over ten years 39, and the Commonwealth Fund projects they could drop rural hospital Medicaid revenue by as much as 9.6% and raise uncompensated care costs by as much as 35.4% 8. A hospital on the metro fringe that was already marginal does not expand a cardiology service line or open a geriatric clinic in that environment. It cuts, consolidates, or closes, at the precise moment its catchment is filling with the highest-utilization patients in medicine.
And the closures are drifting toward this ground specifically. Sheps Center research tracking three decades of rural hospital closures finds them increasingly occurring in counties that are more urbanized, more diverse and more economically unequal than rural counties overall, and increasingly likely to be primary care shortage areas by the end of the period 31. The closure frontier is not staying in the deep rural interior. It is moving out toward the ring this article is about.
The pre-hospital layer is thinner still, and almost never counted. Research from the Maine Rural Health Research Center identified ambulance deserts, places where residents live more than 25 minutes from the nearest ambulance station, and found 4.5 million people living in one across the 41 states it studied 30. For a stroke, a hip fracture or a cardiac event in an older adult, the ambulance is the first link in the chain, and in these geographies it is frequently the weakest.
The squeeze, in five numbers. 98 vs 286 active physicians per 100,000, rural vs urban, against a national 263 6. Fewer than 7,000 geriatricians working nationwide, against a 2017 federal projection of about 33,000 full-time equivalents needed by 2025 4,5. ~23% projected decline in the rural physician supply by 2030, about 12 to 9.4 per 10,000 32. 417 rural hospitals vulnerable to closure, heading into a decade of projected Medicaid cuts 7,8,39. 4.5 million people living more than 25 minutes from the nearest ambulance station 30.
The dependency ratio makes it worse than it looks
There is a second number in the Census release that turns this from a hard problem into a compounding one. While the 65-and-older population grew 16.2% nationally, the 45-to-64 population shrank 3.2%, a decline of nearly 2.7 million people 1. In the Northeast and Midwest, that mid-life cohort fell more than 6% 1. Only in the South did it hold roughly flat.
That 45-to-64 group is not just another age band. It is the group that provides most of the informal family caregiving in this country, staffs a large share of the clinical workforce, and pays the payroll taxes that fund Medicare. It is contracting at the same moment the population that depends on it is expanding.
Each of those three roles now has a price tag attached, and they are all large.
What the shrinking cohort is actually carrying. $1.01 trillion. The estimated annual economic value of unpaid family caregiving, from 59 million caregivers providing 49.5 billion hours at an average of 27 hours a week 27. That is the invisible subsidy holding post-discharge recovery together, and it is supplied largely by the cohort that just shrank 3.2%. $80 billion. Healthcare spending on non-fatal falls among older adults in 2020, with Medicare paying the majority, about two-thirds, and the annual toll projected to exceed $101 billion by 2030 28,40. Falls are the outcome the exercise-access gap most directly drives. 2033. The year the Medicare Hospital Insurance trust fund is projected to become insolvent, per the 2026 Trustees Report released June 9, 2026 29. Part A is funded by a payroll tax on wage income, levied on the working-age population that is contracting.
Put those three together and the dependency squeeze stops being an abstraction. The trillion-dollar informal workforce is thinning, the falls bill it partly exists to prevent is growing toward $101 billion, and the trust fund that pays for the hospitalizations is seven years from insolvency, all driven by the same cohort inversion, all landing hardest where the care network is thinnest.
Then add the exurb's own geography. Every senior who moves to an exurb is more likely to be relying on adult children who live in a different metro, or a different state, than the ones they left. And the commute data shows what "nearby" means out there: 59.8% of solo drivers in Kaufman County commute 30 minutes or more, against 36.5% nationally, with Jasper and Jackson both near 53% 16. That figure is the statistical signature of an exurb, and it is also a caregiving constraint. In a county built around a long drive, the adult child who technically lives in the same metro may be ninety minutes from the follow-up appointment. The informal caregiving that quietly holds post-discharge recovery together gets stretched across a longer drive, or disappears.
The group that funds Medicare, staffs the wards, and drives Mom to her follow-up is shrinking. The group that needs all three is surging. The exurbs are where those two curves cross first.
This is why the exurban senior surge is not simply an access story. It is an access story stacked on a workforce story stacked on a caregiving story stacked on a financing story, all pointing the same direction, all landing on the same thinly served ground.
Where this actually kills people: the transition home
The gap does not show up first in a headline hospital closure. It shows up in the space between the hospital and the home, in the 30 to 90 days after a discharge, and older patients on the metro fringe are uniquely exposed there.
Consider the index case I know best. An older adult in an exurban county has a fall, or a stroke, or a traumatic brain injury. The acute care may be fine, often delivered after a longer transport to a metro trauma center. Then they are discharged back to a county with sparse home health coverage, few outpatient rehab slots, a long drive to neurology or cardiology follow-up, and adult children an hour or more away. That is the exact profile that produces missed follow-up, medication errors, undetected deterioration, preventable readmission, and for brain-injury and stroke survivors, a sharply elevated fall risk that the local network is not staffed to catch. The care that determines whether a discharge becomes a recovery or a decline is post-acute and community-based, and it is the thinnest layer of all in these counties.
The financial consequence lands on the hospital, not just the patient. Under the Hospital Readmissions Reduction Program, CMS cuts a hospital's base operating payments by up to 3% for excess 30-day readmissions in the target conditions. For fiscal 2027 it penalized 2,334 hospitals, about 80% of those evaluated, in the first year the program's data included Medicare Advantage patients 41. In AHRQ's most recent count by payer, Medicare patients accounted for about 2.3 million 30-day readmissions in a year, a 16.9% readmission rate 42. A hospital serving an exurban catchment is therefore paid to prevent readmissions in a county where it does not control the post-acute network, and where a meaningful share of the determinants sit outside its walls. That is not a reason to ignore the exposure. It is a reason to own the network deliberately rather than assume it.
The demographic data cannot see any of this. The Census release says nothing about hospitals, home-health agencies, or follow-up capacity, and any responsible use of it has to keep the verified population facts separate from the inferred health consequences. But the direction is no longer only an inference. The preventable hospitalization rates, the life expectancy deficits and the injury death rates in these counties are measured, not projected. When you move the highest-need population to the lowest-density care setting and simultaneously shrink the caregiver pool around them, the transition home is where the system fails, and it fails quietly, one readmission and one preventable decline at a time.
What health systems, clinicians, and communities do about it
This is a planning problem with a real planning window, because the Census just told everyone exactly where the demand is going. The counties are named. The move is not finished. That is the opening.
Plan to the exurban ring, not the metro core. Health-system capital and service-line planning still tends to optimize for the dense center. Pull the county-level Vintage 2025 growth data, identify the outlying counties graying fastest in your catchment, and site geriatric, cardiac, and post-acute capacity ahead of the curve instead of chasing it.
Baseline every target county on outcomes, not provider counts. Will County shows why. Before siting anything, pull the county's preventable hospital stays rate, life expectancy, senior share and 65-plus preventive screening rates alongside the provider ratios 16. A county with adequate physician numbers and a high ambulatory-care-sensitive admission rate has a system problem, not a supply problem, and the fix is different.
Build the USPSTF A and B list as a capacity plan, not a quality metric. Most Grade A and B services for adults 65 and over are already covered without cost sharing 25,36, which makes them a funded demand curve. Inventory which of them can actually be delivered in each target county, DXA, low-dose CT, colonoscopy, behavioral health follow-up, a supervised exercise program, and treat the gaps as a build list with reimbursement already attached 24.
Make the exurbs telehealth-first on purpose, and check the broadband first. The specialties that are absent locally, geriatrics, neurology, cardiology, behavioral health, are the ones that travel best over video. The connectivity is often already there: broadband access runs 91% in Kaufman and 94% in Jackson, at or above the national 91%, while Jasper trails at 86% 16. So tele-specialty is a viable primary access strategy in two of these three counties today, and in the third the connectivity gap has to be solved first rather than assumed away.
Own the transition, not just the admission. The value and the risk both sit in the 30-to-90-day window after discharge. Structured care-transition programs, standardized discharge navigation, and patient-and-family education aimed at the first three months home are the highest-leverage investment for this population, and the cheapest relative to a readmission and its HRRP penalty.
Fix the designation blind spot. If your fast-growing exurban counties are administratively metropolitan, they may be locked out of rural shortage designations and funding they functionally qualify for on the ground. HRSA's geographic primary-care threshold is 3,500 residents per physician 9, and Kaufman at 4,660 to 1 and Jasper at 4,580 to 1 both clear it on a head count 16. HRSA counts full-time-equivalent physicians in a defined service area, so a head count is a screen rather than a designation. But the contrast is instructive: Jasper already sits inside a designated geographic shortage area, and Kaufman, at a similar ratio, holds no current primary care designation at all 10. Document it, pursue population and geographic HPSA designations where the numbers support them 9,10, and make the invisibility visible to payers and policymakers.
Build the caregiver into the care plan. With the 45-to-64 cohort shrinking, often geographically distant, and already supplying a trillion dollars a year of unpaid work 27, assume the informal caregiver is remote or absent. Design discharge plans, remote monitoring, and community support around that reality rather than a family member who lives ten minutes away.
Fund the exercise program. It is the cheapest thing on this list. Falls prevention through exercise is a Grade B recommendation, a stronger grade than the Task Force gives multifactorial falls programs 21, it needs a room and an instructor rather than a scanner, and the national fall death rate is moving away from its 2030 target 19. In counties where fewer than half of residents have adequate access to exercise opportunities, a community program is the highest-return, lowest-capital intervention available.
For clinicians: read the map before you discharge. A discharge plan that would work in the city can fail in an exurb with no home-health coverage and a two-hour round trip to follow-up. Ask where the patient is actually going home to, and build the plan for that county, not for an average one.
The bottom line
The Census Bureau framed Vintage 2025 as a story about Southern growth, and it is. But the number that matters for anyone who runs, staffs, or plans a health system is narrower and sharper than the headline. The oldest, highest-need Americans are concentrating fastest in the outlying counties of Southern metros, where the care infrastructure is closest to rural in density and furthest from rural in the help it can claim.
What has changed since this pattern was first visible is that it is no longer a forecast. The preventable hospitalization rates in these counties already run above their states and the nation. Life expectancy already runs as much as four years short. The national fall death rate is already moving the wrong way. Six of the country's own older-adult health objectives are, on inspection, outpatient access measures, and the counties absorbing the surge are already failing the county-level version of them. The preventive services that would blunt all of this are already paid for by federal law and undeliverable for want of a building, a program, or a referral destination.
None of that requires courage to forecast. It is arithmetic on numbers the federal government just published and named down to the county. The systems that win the next decade will read the exurban ring correctly and build for it now, while it is still a planning problem. The ones that keep optimizing for the dense center will meet the same population later, in the emergency department, after the transition home already failed.
Planning for a market the senior surge is landing on?
A3HCS helps health systems and post-acute operators turn county-level demographic data into capacity, service-line and care-transition strategy: baselining target counties on outcomes rather than provider counts, siting capacity ahead of demand, and building the discharge-to-home programs that keep readmissions and preventable decline down.
Brain Revives works the patient side of the same gap, with post-discharge education and care-transition support for brain-injury and stroke survivors and their families, the population most exposed when the network on the metro fringe is thin.
References
- U.S. Census Bureau. Vintage 2025 Population Estimates (Press Release CB26-105), released June 25, 2026. National, regional, and county-type age structure. census.gov
- U.S. Census Bureau. Slow Growth Impacts Nation's Largest Counties Hardest, metro/micro and county population estimates (Press Release CB26-56), March 2026. Fastest-growing counties of 20,000 or more, July 2024 to July 2025: 9 of the top 10 and 45 of the top 50 in the South. census.gov
- Henderson T. New census estimates show movers swelling population in small Southeast counties (Jasper County SC the fastest-growing county of its size, 2024 to 2025; Kaufman County TX near Dallas; Jackson County GA near Athens). Stateline, March 26, 2026. stateline.org
- America's Health Rankings. Senior Report, Geriatric Providers measure (United Health Foundation, May 2026), citing American Geriatrics Society data: fewer than 7,000 geriatricians working in 2025. americashealthrankings.org
- Health Resources and Services Administration, National Center for Health Workforce Analysis. National and Regional Projections of Supply and Demand for Geriatrics: 2013-2025. April 2017. 2025 projection: supply of 6,230 and demand of 33,200 full-time-equivalent geriatricians. bhw.hrsa.gov
- Association of American Medical Colleges. Rethinking Rural Health (2022 active physicians per 100,000 population: 98 in rural areas, 286 in urban areas, 263 nationally across all ZIP codes). aamc.org
- Chartis. 2026 Rural Health State of the State (417 rural hospitals vulnerable to closure; 41.2% of rural hospitals operating in the red). February 10, 2026. chartis.com
- Commonwealth Fund. Why Rural Hospitals Face a Funding Crisis and How It Could Get Worse (rural hospital Medicaid revenue could fall by as much as 9.6%; uncompensated care costs could rise by up to 35.4%). Feb 2026. commonwealthfund.org
- Code of Federal Regulations. 42 CFR Part 5, Appendix A, Criteria for Designation of Areas Having Shortages of Primary Medical Care Professional(s) (population to full-time-equivalent primary care physician ratio of at least 3,500:1, or 3,000:1 with unusually high needs). ecfr.gov
- HRSA. HPSA Find and primary care HPSA data download (Jasper County SC lies within the designated "Beaufort and Jasper Counties" geographic primary care HPSA; Kaufman County TX holds no current primary care designation, its low-income population designation withdrawn in 2011). data.hrsa.gov
- County Health Rankings & Roadmaps, 2025 release with March 2026 data update. Kaufman County, Texas. countyhealthrankings.org
- County Health Rankings & Roadmaps, 2025 release with March 2026 data update. Jasper County, South Carolina. countyhealthrankings.org
- County Health Rankings & Roadmaps, 2025 release with March 2026 data update. Jackson County, Georgia. countyhealthrankings.org
- South Carolina Office for Healthcare Workforce (SC AHEC). 2026 South Carolina Health Professions Data Book, published January 2026, revised March 2026 (Jasper County: whole-county HPSA for primary care and mental health; 9 primary care physicians in 2023; 41 general hospital beds in 2025; 38.8% of hospital discharges within home county in 2023). scahec.net
- U.S. Census Bureau QuickFacts, Kaufman County, Texas. census.gov
- County Health Rankings & Roadmaps. 2025 national analytic data file (analytic_data2025_v3.csv) and the March 2026 supplemental data update (analytic_supplement_20260325.csv), the source files behind the county pages in refs 11 to 13. Supplement values are used for provider ratios, preventable hospital stays, life expectancy, premature mortality, motor vehicle and injury deaths, uninsured, broadband, mammography and flu vaccination. The 2025 file is used for senior share, median household income, exercise access and long commute, which the supplement did not update. CHR has said the 2025 release is its final annual release. countyhealthrankings.org
- Healthy People 2030 (ODPHP). Older Adults objectives and the healthy-aging custom objective set (OA-01 through OA-07, DIA-01 through DIA-03, RD-D03, O-02, IVP-08 and related). odphp.health.gov
- Healthy People 2030 (ODPHP). OA-03, Reduce the rate of emergency department visits due to falls among older adults (baseline 6,052.2 per 100,000 in 2016; target 5,447; HCUP-NEDS). odphp.health.gov
- Healthy People 2030 (ODPHP). IVP-08, Reduce fall-related deaths among older adults (baseline 64.4 per 100,000 in 2018; target 63.4; 78.1 in 2024; status: getting worse). odphp.health.gov
- Healthy People 2030 (ODPHP). Health Care Access and Quality objectives, including AHS-04, AHS-07 and AHS-08. odphp.health.gov
- U.S. Preventive Services Task Force. Falls Prevention in Community-Dwelling Older Adults: Interventions (exercise interventions Grade B; multifactorial interventions Grade C; June 2024). *JAMA* 2024;332(1):51-57. uspreventiveservicestaskforce.org
- U.S. Preventive Services Task Force. Depression and Suicide Risk in Adults: Screening (depression screening Grade B including older adults, June 2023; suicide risk screening Grade I). uspreventiveservicestaskforce.org
- U.S. Preventive Services Task Force. Osteoporosis to Prevent Fractures: Screening (women 65 and older, Grade B, January 2025). uspreventiveservicestaskforce.org
- U.S. Preventive Services Task Force. A and B Recommendations (colorectal cancer screening Grade A ages 50 to 75 and Grade B ages 45 to 49; lung cancer LDCT Grade B ages 50 to 80 with a 20 pack-year history who currently smoke or quit within 15 years; hypertension screening Grade A; statin use for primary prevention Grade B ages 40 to 75 with a cardiovascular risk factor and 10-year risk of 10% or more; abdominal aortic aneurysm screening Grade B, one-time, men 65 to 75 who have ever smoked). uspreventiveservicestaskforce.org
- Congressional Research Service. The ACA Preventive Services Coverage Requirement, IF13010 (PHSA section 2713: private insurance coverage of USPSTF Grade A and B services without cost sharing). congress.gov
- Agency for Healthcare Research and Quality. Prevention Quality Indicators (PQI) overview: hospital admissions for ambulatory care sensitive conditions as a marker of outpatient access and quality. qualityindicators.ahrq.gov
- AARP Public Policy Institute. Valuing the Invaluable, 2026 update ($1.01 trillion annual value; 59 million family caregivers; 49.5 billion hours; average 27 hours per week; $20.41 per hour). March 26, 2026. aarp.org
- National Council on Aging. Get the Facts on Falls Prevention ($80 billion in 2020 healthcare spending on non-fatal older-adult falls, 67% paid by Medicare; projected to exceed $101 billion by 2030), drawing on CDC data. ncoa.org
- Medicare Board of Trustees, 2026 Annual Report (Hospital Insurance trust fund projected insolvent in 2033), released June 9, 2026, as reported by the American Hospital Association. aha.org
- Jonk Y, Milkowski C, Croll Z, Pearson K. Ambulance Deserts: Geographic Disparities in the Provision of Ambulance Services (4.5 million people live more than 25 minutes from the nearest ambulance station; 41 states, 2021 to 2022 data). Maine Rural Health Research Center, Muskie School of Public Service, University of Southern Maine. ruralhealthresearch.org
- Cecil G. Sheps Center for Health Services Research, UNC. Rural Hospital Closures Have Increasingly Occurred in Counties That Are More Urbanized, Diverse, and Economically Unequal (1990 to 2020 closure analysis). shepscenter.unc.edu
- Skinner L, Staiger DO, Auerbach DI, Buerhaus PI. Implications of an Aging Rural Physician Workforce. *N Engl J Med* 2019;381(4):299-301, PMID 31340091 (rural physician FTEs held steady at about 12 per 10,000 population from 2000 to 2017 and are forecast to fall 23% to 9.4 per 10,000 by 2030; by 2017 more than half of rural physicians were at least 50 and more than a quarter at least 60). pubmed.ncbi.nlm.nih.gov
- U.S. Census Bureau. County Population Totals and Components of Change, 2020 to 2025 (co-est2025-alldata.csv), Vintage 2025 estimates. County and state total population for April 1, 2020 base through July 1, 2025. www2.census.gov
- U.S. Census Bureau. County Population by Age and Sex, 2020 to 2025 (cc-est2025-agesex-all.csv), Vintage 2025 estimates. The 65-and-older county growth figures for Illinois and Wisconsin are computed from the AGE65PLUS_TOT column, April 1, 2020 base against July 1, 2025. www2.census.gov
- Miller A. Another rural hospital to close in Georgia, this time in Commerce (Northridge Medical Center, Jackson County; acute-care hospital closing October 31, 2020, nursing home remaining open). Georgia Health News, August 19, 2020. georgiahealthnews.com
- Centers for Medicare & Medicaid Services. Transmittal 864, Waiver of Coinsurance and Deductible for Preventive Services, Section 4104 of the Affordable Care Act (effective January 1, 2011). cms.gov
- Centers for Medicare & Medicaid Services. State Medicaid Director Letter SMD #13-002, Affordable Care Act Section 4106 (one percentage point FMAP increase for states that cover USPSTF Grade A and B services and ACIP-recommended adult vaccines without cost sharing). 2013. medicaid.gov
- Centers for Medicare & Medicaid Services. National Coverage Determination 210.14, Screening for Lung Cancer with Low Dose Computed Tomography (ages 50 to 77; effective February 10, 2022). cms.gov
- Saunders H, Burns A, Levinson Z. How Might Federal Medicaid Cuts in the Senate-Passed Reconciliation Bill Affect Rural Areas? KFF, July 2025 (federal Medicaid spending in rural areas estimated to decline by $137 billion over 10 years). kff.org
- Haddad YK, Miller GF, Kakara R, et al. Healthcare spending for non-fatal falls among older adults, USA. *Inj Prev* 2024;30(4):272-276. PMID 39029927 ($80.0 billion in 2020, the majority paid by Medicare). pubmed.ncbi.nlm.nih.gov
- Pifer Parduhn R. Medicare penalizes more hospitals for readmissions (2,334 hospitals, 80%, penalized for fiscal 2027; 10 at the 3% maximum; first year based on data including Medicare Advantage beneficiaries). Healthcare Dive, October 8, 2026. healthcaredive.com
- Weiss AJ, Jiang HJ. Overview of Clinical Conditions With Frequent and Costly Hospital Readmissions by Payer, 2018. HCUP Statistical Brief #278. Agency for Healthcare Research and Quality, July 2021 (2,290,100 Medicare 30-day all-cause readmissions; 16.9% rate). hcup-us.ahrq.gov